The Park Assist plugin for VBOX Test Suite gives you the ability to complete a successful acceleration test by selecting the speed the test will start at and either a speed or distance at which the test will end. You can also end the test at the end of acceleration and start the test on a user-defined trigger, such as throttle position or a set RPM value.
- Click the Add button in the Test section on the Home tab.
- Select the ADAS Test category and the Park Assist test.
- Select New Test.
- Click OK to add the selected test.


When you add a new test, the test settings window will automatically open when the test opens.
- Click on the dropdown arrow to select the channel you want to use for the start condition for the test.
- Set the relevant value if required.
- Click on the dropdown arrow to select the channel you want to use for the end condition,
- Set the relevant value if required.
- Configure the Bay Sides as described below.
- Select the Measurement Options.
- Configure any required Interim Results and Pass Conditions.
- Click OK.
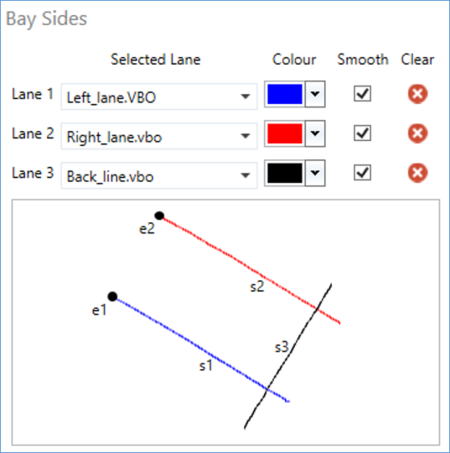
When plotting (recording) a bay side, you must extend the bay side past the corner point with a clear overlap. When you configure the sides of a bay, you must make sure that the side of the bay starts at the entry point and finishes past the intersection of the base line (s3 in the example below).
When you have defined 3 lines, the software will automatically determine 2 entry points for the bay, taking the furthest point from each intersection.
To configure the bay sides in Test Suite, you can either load a separate pre-plotted lane file for each bay side or survey the lanes using Online mode in Test Suite.
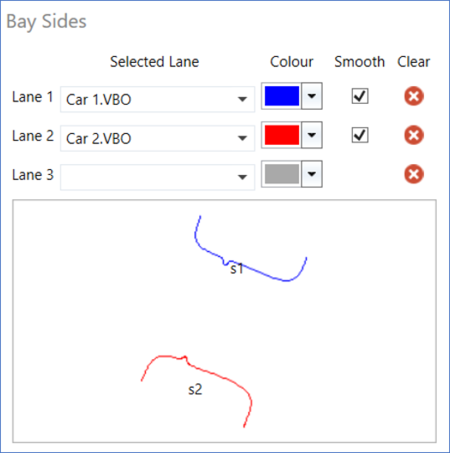
You can add 2 complex shapes instead of straight lines as bay sides. This is for testing in situations where there are no parking bay lines, but other items, such as vehicles.
In the example below, you can see that the sides of 2 vehicles were surveyed and located on either side of the parking space of interest.
When using complex shapes, you must make sure that the Smooth option is not selected. This will ensure that details, such as wing mirrors, can be included in the calculations of the measurement distance.
IMPORTANT
When you are using a complex shape, Test Suite will not apply entrance points and the channels will not be included in the processed files.
To configure the bay sides in Test Suite, you can either load a separate pre-plotted lane file for each bay side or survey the lanes using Online mode in Test Suite.
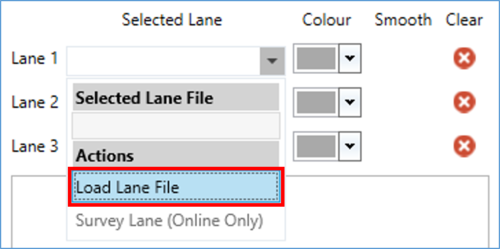
You can load bay sides from saved VBOX files (.vbo/.vbb), lane departure files (.vbc), PerformanceBox/DriftBox/VBOX Mini files (.dbn) files or previously surveyed files.
- Select the dropdown menu next to a lane and click on Load Lane File.
- Navigate to the file with the required lane and click Open.
- Repeat for the other 2 lanes.

IMPORTANT
This feature is only available in Online Mode.
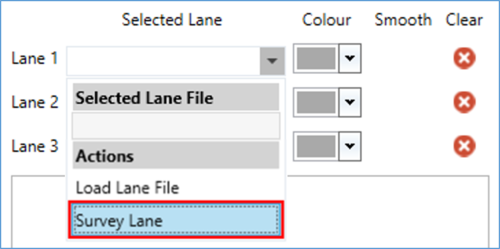
When you have connected VBOX Test Suite to a VBOX in Online mode, you can survey the lanes directly in Test Suite.
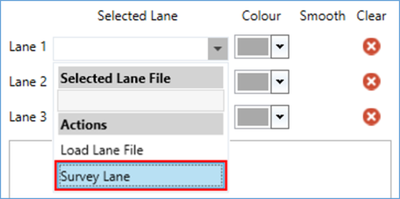
- Select the dropdown menu next to a lane and click on Survey Lane.
When you have connected VBOX Test Suite to a VBOX in Online mode, you can survey the lanes directly in Test Suite.
- Select the dropdown menu next to a lane and click on Survey Lane.
The Survey Lane dialogue will open:
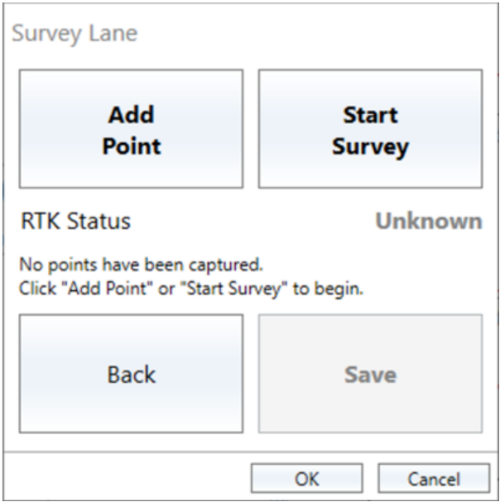
The current RTK status of the connected VBOX is displayed to give you a clear indication of the DGPS correction status before you begin the survey.
RTK Status messages:
- Fixed (green)
- Float (yellow)
- Not Fixed (red)
- No Solution (red)
- Unknown (Grey)
IMPORTANT
For the status to work correctly, you must make sure that the you set the Solution Type channel to Send over serial when you configure the connected VBOX in the VBOX Setup Software.
Select the method you want to use to survey the lane and follow the steps for the relevant method below:
- Make sure that you have the VBOX equipment required for surveying as per the user guide of your VBOX product.
- When the VBOX displays RTK Fixed you can start the survey.
- Click the Add Point button to add a point at the current location of the surveying antenna.
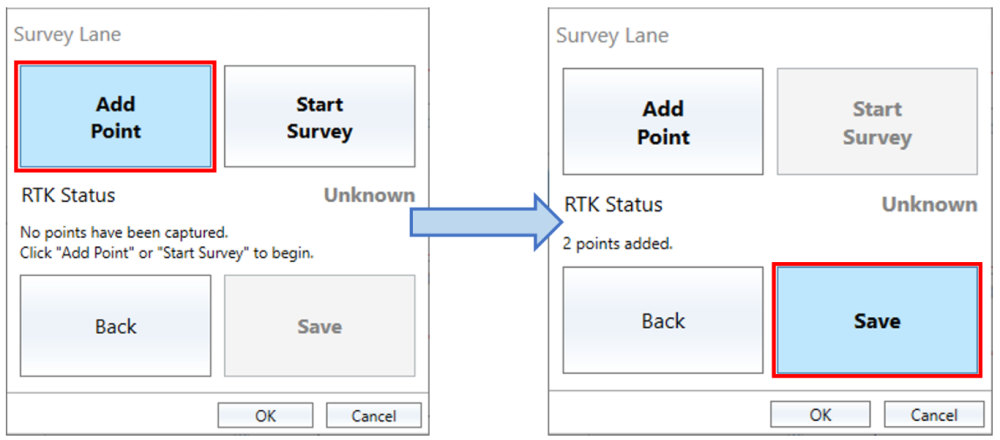
You can see the number of points added in the Survey Lane dialogue.
- When you have added all the required points (minimum 2), click Save and choose a suitable location and filename for the lane file.
- Repeat the process for the other lanes required for the test.
When you have saved the file, the lane in it will be added to the relevant Lane number in the Bay Sides settings.
You can reuse the surveyed lane later by loading the saved file into the software again.
- Make sure that you have the VBOX equipment required for surveying as per the user guide of your VBOX product.
- When the VBOX displays RTK Fixed you can start the survey.
- Move the surveying antenna to the first point of the lane.
- Click Start Survey.
The Survey Lane window will display Surveying ...
- Walk along the lane you are surveying with the survey antenna directly above the lane.
- When you reach the end point of the lane, click Stop Survey.
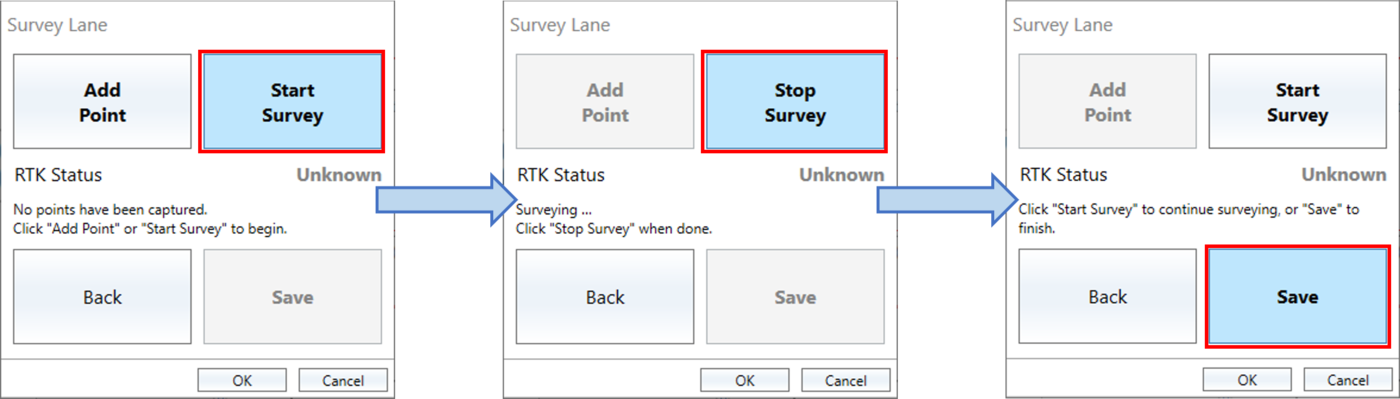
- Click Save and choose a suitable location and filename for the lane file.
- Repeat the process for the other lanes required for the test.
When the VBOX Test Suite has saved the file, the surveyed lane will be added to the Bay Sides settings.
You can reuse the surveyed lane later by loading the saved file into the software again.
When you have added the required lanes to your test configuration, you can configure them further as follows:
- Set the colour for each side by clicking on the dropdown arrow and selecting the required colour.
- Add/remove smoothing to a selected lane by ticking/unticking the Smooth box next to the lane.
- Remove a file and its colour selection by clicking on the Clear button on the right-hand side of the relevant lane.
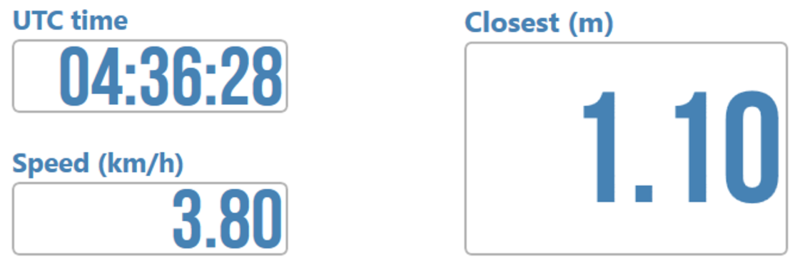
Along with the usual dashboard functionality, the Park Assist Test has some extra options.
Click Add Gauge in the Dashboard tab on the ribbon to see a dropdown list where you can select a test parameter you wish to display, such as:
- Run
- Time (s)
- End Speed (km/h)
- Distance (m)
- Avg Accel (g)
- OK Runs
- Run Status
- Run Time (s)
- Run Distance (m)
The software will add a gauge to the dashboard.
All the Result Column parameters will also be available as gauges.
Gauges that display the result of a test, such as an average or maximum value, will have a result icon to the left of the gauge name to indicate that it is either a result of the previous run if you are viewing live data, or the currently selected run if you are viewing a saved file.
- Click the Online button in the Data section on the Home tab.
- Select the correct COM port from the dropdown list to connect VBOX Test Suite to your VBOX.
When Test Suite has connected to the VBOX unit, the dashboard will change to show the Start, Stop and Reset buttons.

- Click the Start button to add a tab to the Test Results area ready to be populated with results once the start and end conditions have been met.
When you start a test, the Start button will change to a Pause button. When you pause a test the button will change to a Resume button you can use to resume the test.
- Click the Stop button to complete the test.
This will stop all open tests and future results cannot be added to the test's results tab.
- Press the Start button again to start a new test in a new results tab.
If, for any reason, a mistake has been made during the test, you can restart the test by pressing the Reset button.

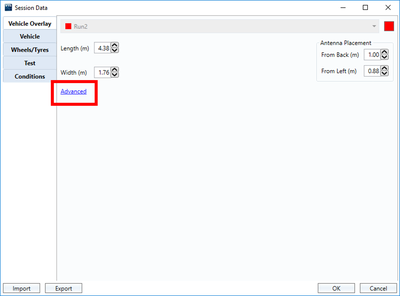
- Click on the Edit Data button in the Session section of the Test Setup tab, or on the session tab in the Results area, to open the Session Data window and enter or import the relevant data for the session.
- Click OK to confirm and close the session data.
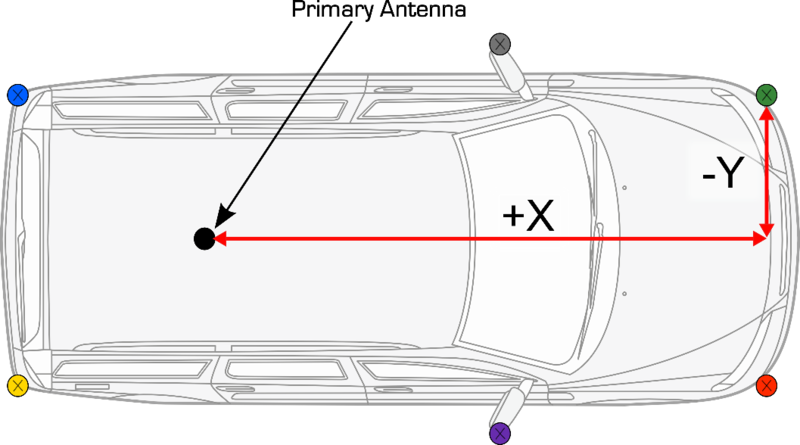
In the vehicle overlay section, you can configure the required vehicle measurement points and enter antenna placement offsets.
There is no limit to the number of vehicle measurement points you can set.
The points should be measured from the primary antenna as illustrated below.
- Click Advanced to expand the window and display the vehicle point editing functionality. This is where you can create custom shapes of the vehicle.
- Click the + button to add another point. You can configure a point by entering the antenna offset values. Alternatively, you can manually move the point to the required location by clicking and dragging it.


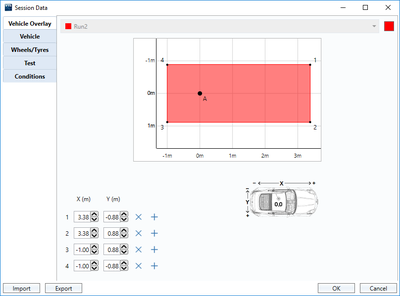
- Click OK to save your settings.
Test Suite will create an object that represents the vehicle and will overlay this on the cursor in the map area.
If you are testing with parking bays, each configured vehicle point will produce the following 5 range channels:
- "relative to entry" point x 2
- "relative to the bay sides" point x 3
If you are testing with complex shapes, each configured vehicle point will produce 2 range channels relative to the shape sides.
IMPORTANT
If you do not enter any vehicle measurement points, the antenna position will be used for all the range calculations.
The results from each run in your test will be populated in the Results table.
You can add and remove columns to the results table.

You can add columns to the Test Results area by clicking the Add button on the Test Setup ribbon or right-clicking anywhere in the Test Results area and selecting the Add option. This will display a drop-down list of all the available channels to display in a results column. By default, this value is displayed as an At End value, which will display the value of the parameter at the end of the run.
You can remove a column by clicking the X that appears when you hover over the column title. If you have removed a column, you can add it again by clicking the Add button and selecting the desired channel.
The Add column dropdown menu will have a list of Park Assist-specific measurements that you can choose from, e.g. p1_s1_range.
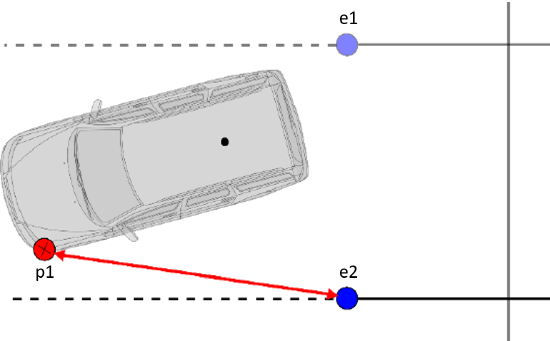
The 2 range measurements to the entrance points of the bay are the ranges in a straight line between the vehicle and the entry points.
The channels will be labelled e1 and e2 relative to what is shown in the ‘bay sides and entrance points’ map.
There will be 2 measurements in relation to the entrance points for every vehicle measurement point.
For example, the p1_e2 measurement is the distance between the second entry point and the first defined vehicle measurement point.
NOTE
e1 and e2 measurements are only available when you are testing with parking bays.
If you are testing with complex shapes, there will be no entrance points applied.
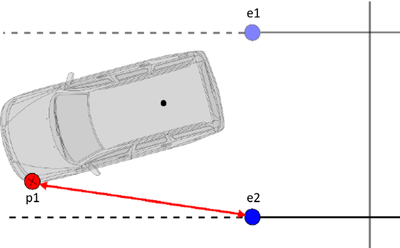
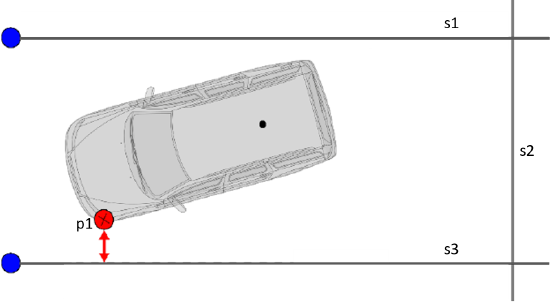
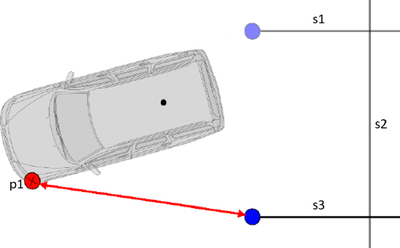
The side range measurements are calculated perpendicular to the headings of the bay/complex shape sides. The created channels will be labelled s1, s2 and s3 relative to what is shown in the bay side and entrance points settings.
There will be 2 or 3 points in relation to the bay sides for every vehicle measurement point.
For example, the p1_s3 measurement is the range of the first defined vehicle measurement point to bay side 3.
NOTE
If you are testing with complex shapes, only s1 and s2 range measurements will be calculated.
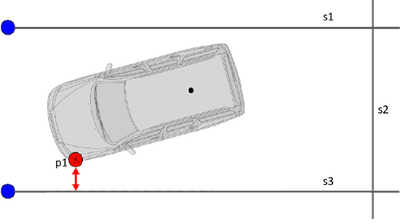
If the vehicle is outside of the configured bay/complex shape, the side range measurements are calculated to the closest side point (i.e. the entrance point for a bay).
NOTE
As all range values are absolute values, they have no signing.

If the vehicle is outside of the configured bay/complex shape, the side range measurements are calculated to the closest side point (i.e. the entrance point for a bay).
NOTE
As all range values are absolute values, they have no signing.
By default, a column is added without a condition. You can change this by clicking on the column header for the channel you wish to add a condition for. The selected column will be highlighted in yellow. Click on the condition dropdown in the Data column area on the Test Setup tab and select the required condition.

You can choose the following conditions for the main results:
- Avg
The mean average of the parameter during the run. - Max
The maximum value of the parameter during the run. - Min
The minimum value of the parameter during the run. - Delta
The difference between the start and end value of the parameter. - At Line
The value of the parameter at the crossing of the specified gate line (e.g. Start/Finish).
You can change the displayed parameter, by selecting a parameter from the dropdown menu above.
You can sort the results in ascending or descending order. To do this, you must click on the relevant column to select it and then click on the Sort Ascending or Sort Descending button on the Test Setup ribbon or right-click in the Test Results area and select the option you need.
You can filter the results by right-clicking on a value in the cell results table (e.g. Time (s)). You can then select to include only results with a value equal to the selected value or with a value that is <= than or >= than the selected value for that channel. You can filter multiple channels. A notification bar above the results will shows the applied filters. You can remove the filters by clicking on the X in the notification bar.
You can copy individual results cells so that they can be pasted into other software applications. Click on the relevant cell to select it, right-click on it and select Copy or use the keyboard shortcut. Select multiple cells by clicking and dragging with the mouse or pressing the Ctrl key when selecting cells. Select all cells between 2 cells by holding down the Shift key and between clicking on the first and the second cell.
You can also copy an individual row, column or the entire results table by selecting the required data area, right-clicking and selecting Copy Row, Copy column or Copy All.
You can rename a column by double-clicking on the column title or by selecting the relevant column and right-clicking and selecting Rename Column or pressing F2 on the keyboard. Renamed columns will be included in exported files and generated reports.
Click on the Export button to display a dropdown menu with the export options. You can export the selected results or line results to a .csv or a .txt file.
You can set the Test Suite software to automatically calculate the Average/Max/Min/Standard Deviation values of all relevant runs by ticking the selection box next to the run number.
Once you have selected more than one result, the average, maximum and minimum values will be displayed. Once you have selected more than two results, it will also display the standard deviation of the selected runs.
If you select the tick box next to the Avg, Test Suite will add a moving average ‘best fit’ curve to all of the selected runs.
If you have specified Interim result(s) in the Test Configuration these will be displayed in the Test Results area.
The Columns setting will display each interim result as a column on the right-hand side of the results table, in the order it was specified in the settings. If multiple At or Between conditions are met in a run, Test Suite will only display the first result.
The Separate Table setting will display the interim results from a selected run in a new window in the Test Results area. If you select multiple runs, the window will display the interim results from the last selected run. In addition to the interim results, the start conditions will also be displayed.
Change a Channel
You can change the channel used for interim result(s), by selecting the column header for the required result and clicking on the channel name in the Data Column section on the Test Setup tab or right-clicking on the column header and and selecting the channel name from the dropdown menu. Both options will display a list of all available channels you can replace with.
Add a Channel
You can also add columns to the interim result(s) by selecting a result header and clicking on the Add button in the Data Column section on the Test Setup tab or by right-clicking on the result header and and selecting the Add option from the dropdown menu. Both options will display a list of the available channels you can select to display as a results column associated to that particular interim result.
Remove a Channel
You can remove a column by clicking on the x icon that appears when you hover over the column header.
NOTE
If you change a channel or add extra columns to the interim result(s) and you save the test configuration, the changed or extra columns will be applied to all interim results in the file when you load it back into the software, not just the specified results.