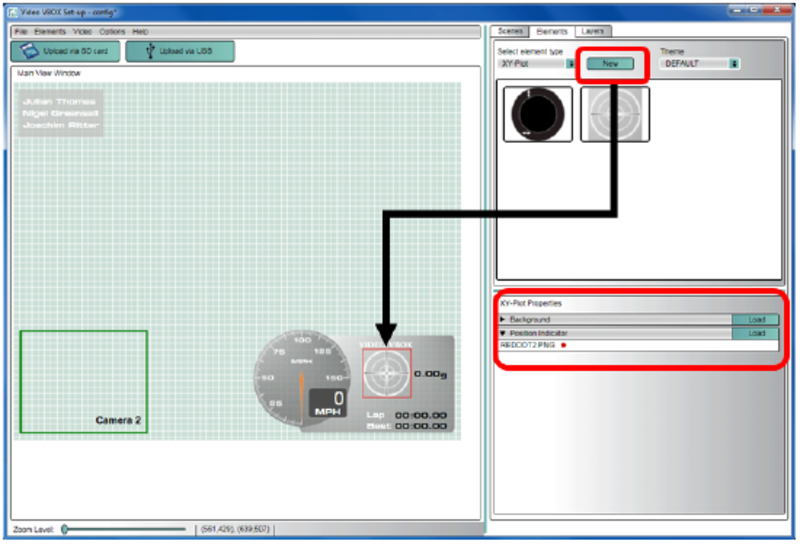
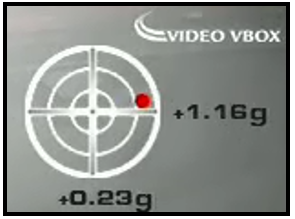
A circular XY Gauge can be used to show G-force as a moving dot. It is created in the same way as the Double Bar Graph but using Elements tab → XY Plot → New
The displayed parameters, ranges and dot type are all adjustable using the XY Plot properties tab.