A Single Bar Graph is a rectangular gauge with an expanding bar which can be used to display any data available from GPS or CAN such as Lateral Acceleration (GPS), Engine Temp (CAN) etc.
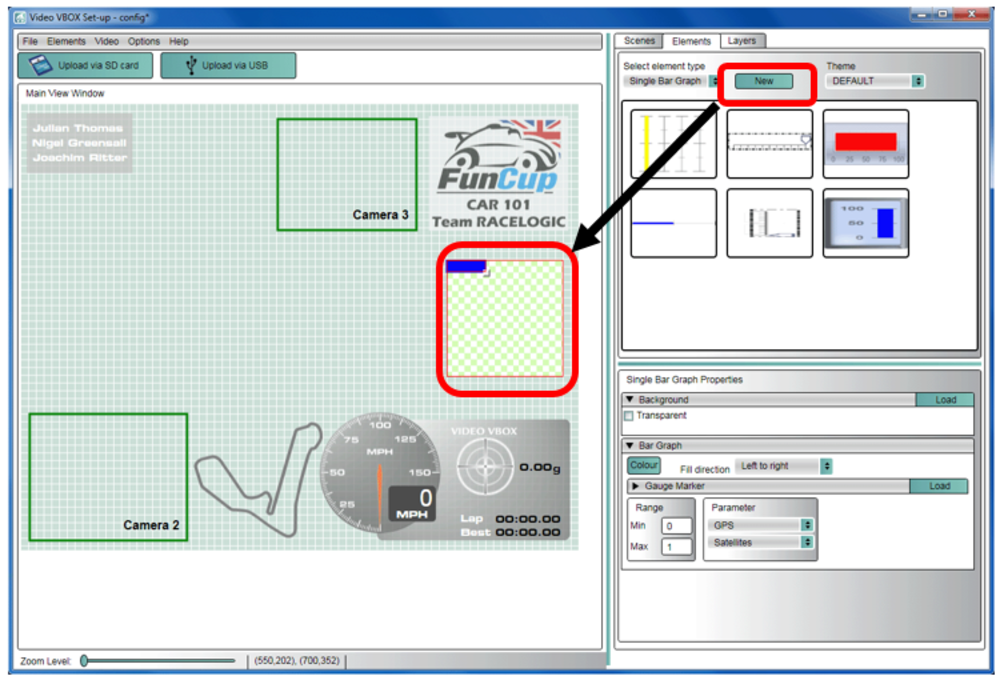
To create a single bar graph, use the Elements tab -> Single bar graph -> New
The bar graph element consists of two items, the background containing the scale and outline, and the parameter associated with the bar graph.
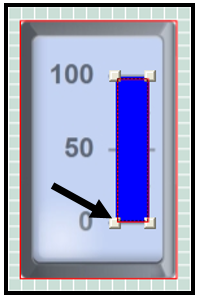
The direction, colour, range and marker (moving pointer), can all be changed using the Gauge Properties tab.
To change the position, height and width of the fill, simply click and drag the corners of the coloured bar.
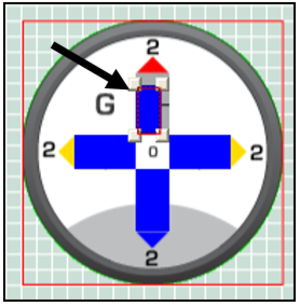
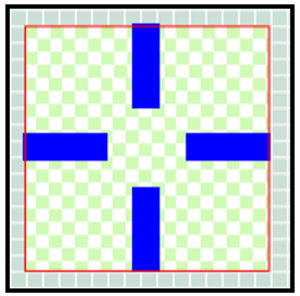
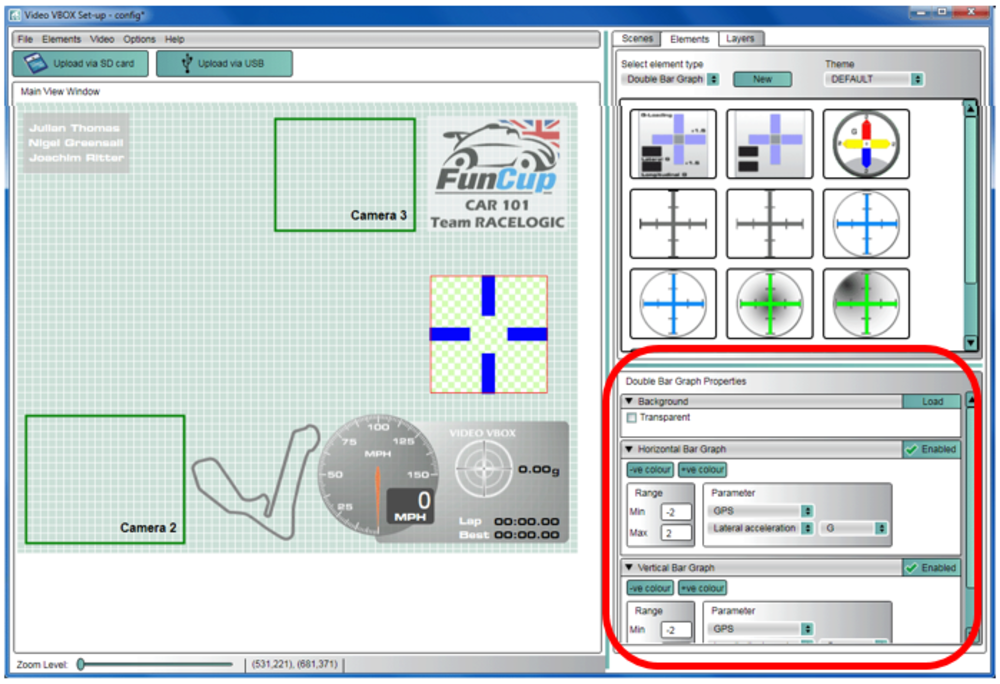
A Double Bar Graph is created in a similar way to the single bar graph using the Elements tab → Double bar graph → New
The default parameters for this element are Lateral acceleration on the X axis and Longitudinal acceleration on the Y axis.


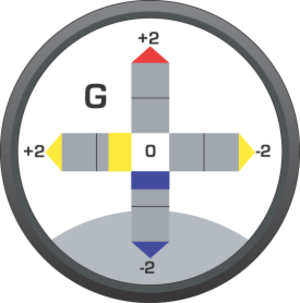
The direction, individual axis colours, associated parameters and ranges are all adjustable using the Double Bar Graph properties tab (highlighted).
To change the position, height and width of the fill, simply click and drag the corners of the coloured bar.