Basic Gauge Creation
The Video VBox setup software is capable of using many different image formats for gauge backgrounds, static images, or logos, including Bitmaps, JPEGs, or PNG’s. When the software compiles the scene and sends it to the box however, it converts any images used in the Scene to a PNG file. PNG images are small but retain detail, so by working with PNG images when creating your gauge background no loss of detail will occur when they are sent to the Video VBOX and you and the software don’t have to perform any additional conversions on the image files.
So you want to create your own gauge? How about a transparent background for those text elements?
There are a number of software packages available which are capable of creating images suitable for use with the Video VBOX. One which has been used extensively by Racelogic for the quick and easy creation of gauges is an open source application called Inkscape.
This tutorial will first cover the creation of a basic gauge using Inkscape. The tutorial is intended as an introduction into how to create a simple gauge face image that can be used in the Video VBOX setup software.
It is by no means exhaustive and we highly recommend reading the Inkscape user manual which covers the basic software controls which the user will need to know to quickly and easily navigate the application.
For this example we are going to create a gauge which shows values from 0 – 160 in steps of 20.
It is completely free to download and install.
Now open the software, the screen below will appear, don’t worry too much about the different buttons for now we will only be using a few of them to create our gauge.
Creating the Dial
First select the circle tool from the toolbar on the left, then while holding down the ‘CTRL’ key drag out a circle. (Holding CTRL keeps the circle exactly round)
In the width and height boxes in the menu bar enter 550 pixels for the width and height.
For this example, choose a dark colour for the background from the colour scroll bar at the bottom, this will be the border for our gauge.
NB: If you need to move the circle (or any other item) you will need to press the ‘Select and Transform’ Button before you can move the circle. (Pressing the F1 key has the same effect)

If you need to resize the circle click on it once using the ‘Select and Transform’ tool, then click and drag on the corner arrow to resize it. If you want to resize the circle and retain the aspect ratio i.e. a circle use the ‘CTRL’ key as you drag.
.png?revision=1)
Now right click on the Circle you have just created, this will bring up the menu shown on the left, and select the ‘Fill and Stroke’ menu option.
.png?revision=1)
This will open the Fill and Stroke menu bar in the right of the screen.
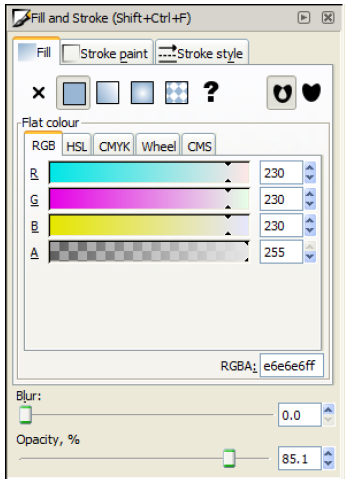
The fill and stroke menu is used to control the shape fill and border colour, thickness, and transparency. Left click on the circle and select the ‘Stroke Paint’ tab.
Select the ‘Flat Colour’ button at the top of the tab. (box with solid fill). Move all the R, G, B, and Alpha (Opacity) sliders to the far right, or enter 255 in all the text boxes on the right. This will make the colour of the circle outline white; I have added this to improve contrast between the recorded video and the gauge.
On the Opacity slider move it to the far right to 100% as our first gauge will be completely opaque.
.png?revision=1)
Now click on the ‘Stroke Style’ tab.
Enter a width value of 5 and make sure the Opacity slider is set to 100%.
.png?revision=1)
Select the circle tool again, once again while holding the ‘CTRL’ key, drag and draw another circle inside the first.
In the Fill and Stroke menu, set the fill colour to white with 100% opacity and select the ‘no paint’ button under the stroke tab.
In the width and height boxes in the menu bar enter 510 pixels for the width and height.
You should now have something like the image on the right.
Now we need to make the Dial markers, we make the marker points first as these give us the exact locations of the numbering when we add those to the gauge face.
It is a matter of preference of how big, what colour, and where on the gauge they are. For this example we’ll keep it simple and create a big marker for the numbers, and a smaller marker for the intermediate markers both in black.
Creating the Dial Markers
Click on the inner circle twice, you should see the outline box arrows change shape and direction and a cross appear in the middle of the circle. This is the centre point (and centre rotation point) of the circle and can be used as a guide to the centre lines of the circle.
.png?revision=1)
Zoom into the Screen using the ‘Zoom’ button, or holding the ‘CTRL’ key and moving the mouse scroll wheel up and down to zoom in and out.
Click the Bezier curves and straight lines button.
Click a point on the centre line of the circle and draw a line, the width of the line can be changed in the ‘width box in the top menu bar. I have used a width of 50 pixels and a height of 1.
NB: You may want to turn off grid snapping to allow you to align the marker correctly with the grid. To do this go to ‘File > Document Properties’ then select the ‘Snap’ tab and turn off ‘Enable Snapping’.
If not already selected choose the ‘select and transform objects’ button

, then select the line you have just created. You should see something like the picture below.
In the ‘Stroke and Fill’ menu, select the Stroke Style tab and enter a width of 10 and select the rounded Cap.
The marker should now look like the picture below.
.png?revision=1)
So now we have created one marker we need to create the others for the dial. The easiest way to do this is to use the duplicate and rotate feature of the software. Before we rotate the marker we have to select the rotation point for the marker, which is also the centre point of the gauge.
Click twice on the marker until the corner arrows change to rotation arrows and a cross appears in the centre of the line.
.png?revision=1)
By clicking and dragging on the cross it is possible to move it to the centre point of the circles. This is the rotation point for the gauge.
By alternately clicking on the circle then back on the marker it is possible to move the rotation point for the marker to the same point as the circle i.e. the centre of the gauge.
The marker can now be duplicated and rotated to create the other markers, the rotation point will also be duplicated so all markers will share the same rotation point.
.png?revision=1)
First we need to define how many degrees we want to rotate each gauge marker.
Click on ‘File’ and select ‘Inkscape Preferences’.
This brings up a pop up a window. Select ‘Steps’ and in the box next to ‘Rotation Snaps Every:’ Select 15 degrees.
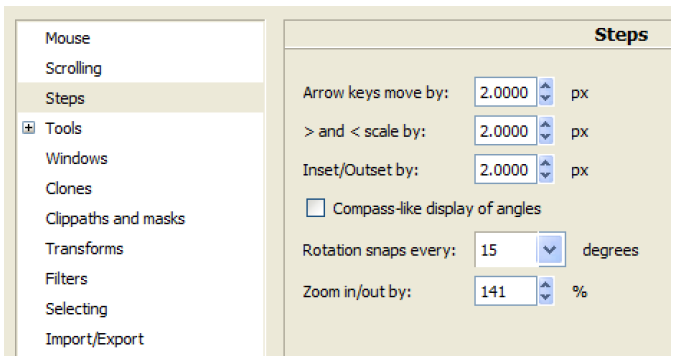
The markers can now be duplicated, and will rotate 15 degrees. Click on the marker until the rotation cross appears, then right click and select ‘Duplicate’ (or press CTRL + D).
Now while holding the CTRL key, click and drag the rotation arrow on the corner of the marker.
By moving the mouse the duplicated marker bar will rotate by 15 degrees around the rotation point defined earlier.
For this example we will rotate the big markers 30 degrees then place a smaller marker point in between the larger ones.
Repeat the duplication and rotate process for each marker point you want on the gauge. For this example we need 9 markers for the 0 – 160 speeds in steps of 20.
When you are finished you should have something which looks similar to the picture below.
Now we need to add our intermediate markers.
Adding the intermediate Markers
Duplicate the first horizontal marker you made and shorten it by holding the CTRL key and clicking and dragging the right hand arrow. In the width and height boxes on the top toolbar
(NB: You may want to turn off grid snapping to allow you to align the marker correctly with the grid. To do this go to ‘File > Document Properties’ then select the ‘Snap’ tab and turn off ‘Enable Snapping’ the marker can then be moved and positioned freely.)
Click on the marker to bring up the rotation arrows and the rotation cross for the small marker and move the rotation point to the centre of the circles as before.
.png?revision=1)
Holding the CTRL key, click and drag the rotation arrow and position the smaller marker between two of the larger markers.
Now repeat the duplicate and rotate process for each of the smaller markers required for the gauge.
Your gauge should look something like the image below.
.png?revision=1)
Adding the Gauge Numbering
Now we need to add the numbering on the gauge. For this example we are going to create a gauge which shows values from 0 – 160, with steps of 20.
 Select the Text tool from the side bar.
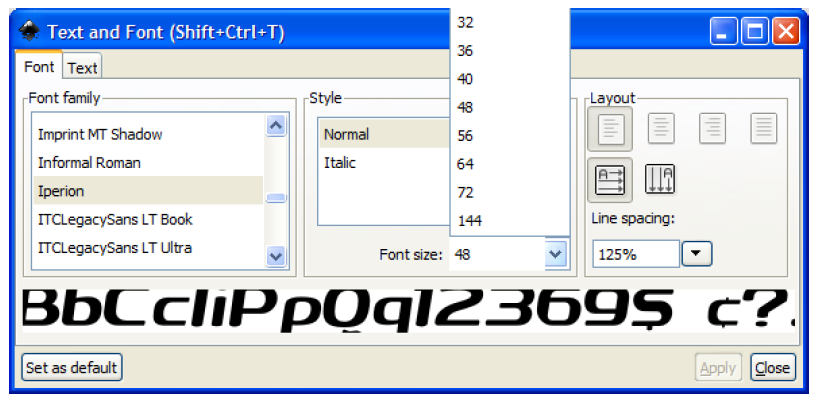
Left click and drag a box near the marker for the zero point of the gauge. Now from the top menu select ‘Text > Text and Font’ which brings up the following menu.
Choose a font size of 48 and whichever font you want to use, for this example I have used the Iperion font, then click on apply in the bottom right.
You should now see an empty text box displayed with a flashing cursor bar, enter the value ‘0’ zero in this text box.
While the text box is in editing mode you cannot move it, to do this you need to press F1 or select the ‘Select and Transform’ button from the sidebar.
Now right click on the ‘0’ text you have just created and select copy, now for each marker where you want a number either press CTRL + V or right click and press paste.
To edit the text in a text box double click on it and enter the required value, then align the text box with the gauge marker.
When you are finished your gauge should look like this.
To export the gauge to an image file for use with the Video VBOX, click and drag a window around the gauge to be exported so that all of the elements are selected.
Exporting the Gauge Image
Click on ‘File > Export Bitmap’
This brings up the ‘Export Bitmap’ window.
Enter a value of 200 into the width and height boxes, this will be the size of the gauge PNG produced when the image is exported.
Click the Browse window and choose a name and location for the image, then click export.
The image can now be loaded into the Video VBOX software for use as a gauge background.
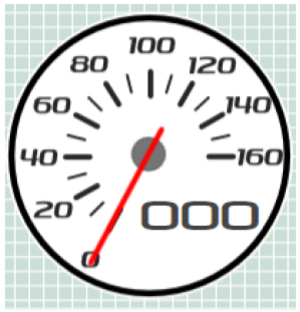
The above tutorial produces the gauge as seen below.
This is a very basic gauge in terms of complexity. More colours and layers can be added to create the effect of glass or chrome reflections, and making the face transparent means more of the video can be seen while still displaying the parameters clearly on the overlay.
By making simple small adjustments to the layers, it is possible to create very different gauges.
.png?revision=1)

.png?revision=1)
.png?revision=1)
.png?revision=1)
.png?revision=1)

.png?revision=1)
.png?revision=1)
.png?revision=1)
.png?revision=1)
.png?revision=1)
.png?revision=1)
.png?revision=1)
.png?revision=1)

.png?revision=1)
.png?revision=1)
.png?revision=1)
.png?revision=1)
.png?revision=1)