01 - Circuit Tools The Art of Going Faster
Introduction
The Circuit Tools software is a data-analysis package designed for Racelogic GPS data-loggers, such as VBOX, Video VBOX, VBOX Sport, DriftBox and PerformanceBox. The software is designed to automate many tasks and quickly present a driver with the crucial information required to improve lap times.
The software is designed by racing drivers for racing drivers, with none of the complexity normally associated with analysis software often aimed at experienced race engineers. The software can work with or without video, but this manual will assume you are using video as this is the most effective way of analysing circuit performance.
The Art of Going Faster
Circuit Tools and Video VBOX exist to help you to go faster, so what is the best way to go about this? By far the most effective way is to get someone quicker to drive your car for a few laps and then compare data. There are a number of professional driver coaches who already use Video VBOX and would be more than happy to help out.
When you have the data of the faster driver, load both files into the software by pressing the F3 key. Examine the Delta-T channel (in blue beneath the speed traces) and look for a big change in lap time.
When Delta-T increases, time is being lost and when it decreases, time is being gained. Have a look at the example below which is zoomed into a section of the track where there was a large change in Delta-T, worth around 3s in lap time.
By zooming in to a section (use the mouse to click and drag a zoom box) you can analyse what is happening by comparing the speed traces:
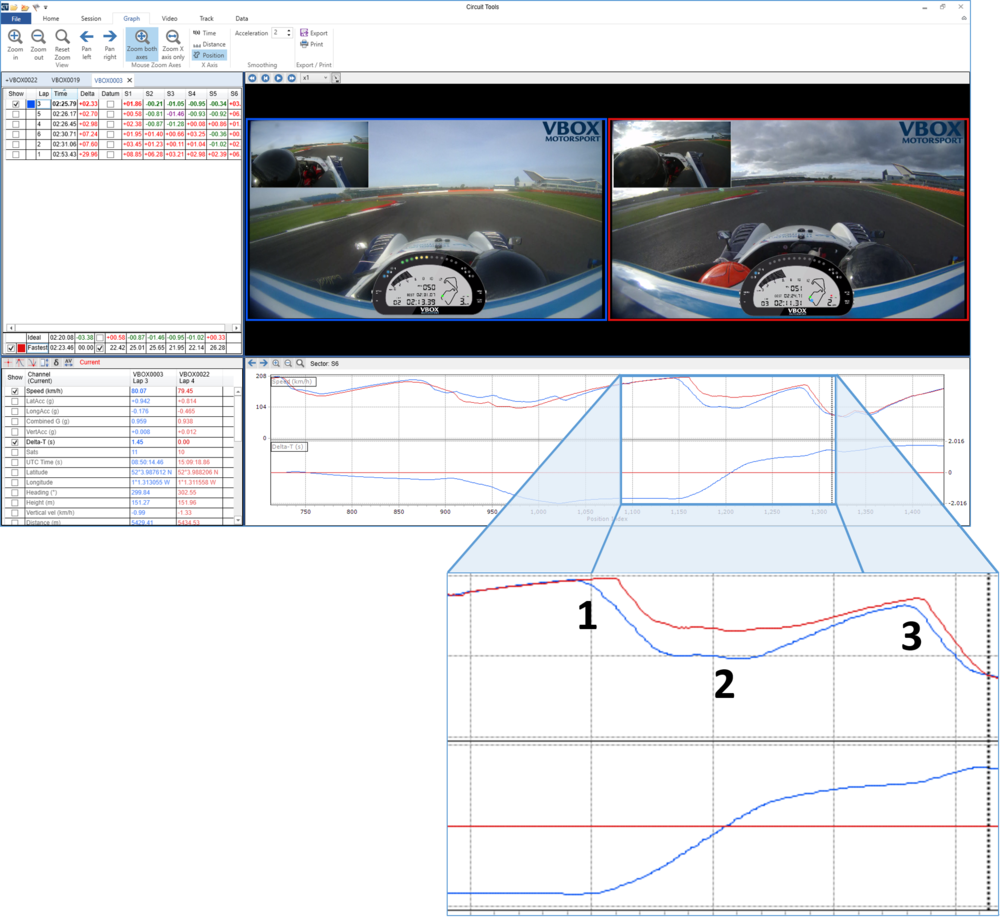
Zoomed in Graph showing 3 critical points
Before the corner, the car with the blue trace was 1.11s quicker
- The car with the blue trace then brakes earlier and lighter for the corner, this loses 0.6s in the braking zone.
- The car with the red trace then uses more throttle on the exit of the corner and around the following left hander, gaining another 2.16s.
- For the next corner, the driver with the red trace again brakes later and harder, gaining another 0.38s.
By making these simple changes, the driver with the blue trace could have gained 3.14s in just these two corners. Ultimately, the car with the red trace is now 2.03s quicker!
The next stage would be to watch the videos side-by-side in slow motion, to observe the lines taken by each driver. It is often useful to check the position of the car relative to the kerbs on the entry, apex and exit of the corner. Move the video one GPS sample at a time by holding down the ALT key and using the right or left arrow keys.
|
Typical areas in which to focus are:
|
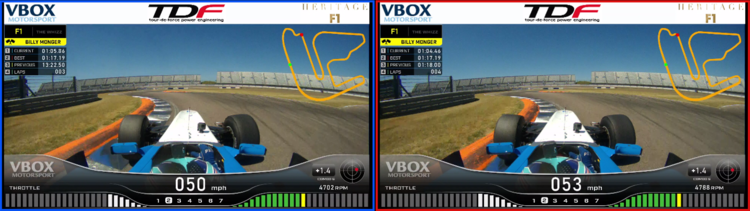 Quicker driver (red outline) using more kerb and speed |
We have written a comprehensive ebook with tips and tricks on going faster using Video VBOX, it is available for free here.