04 - Circuit Tools - macOS Graph
Graph Overview
The Graph lets you compare the channel data for the selected laps. You can select up to 6 channels at any one time, the Speed and Delta T channels are selected by default when the file is opened.
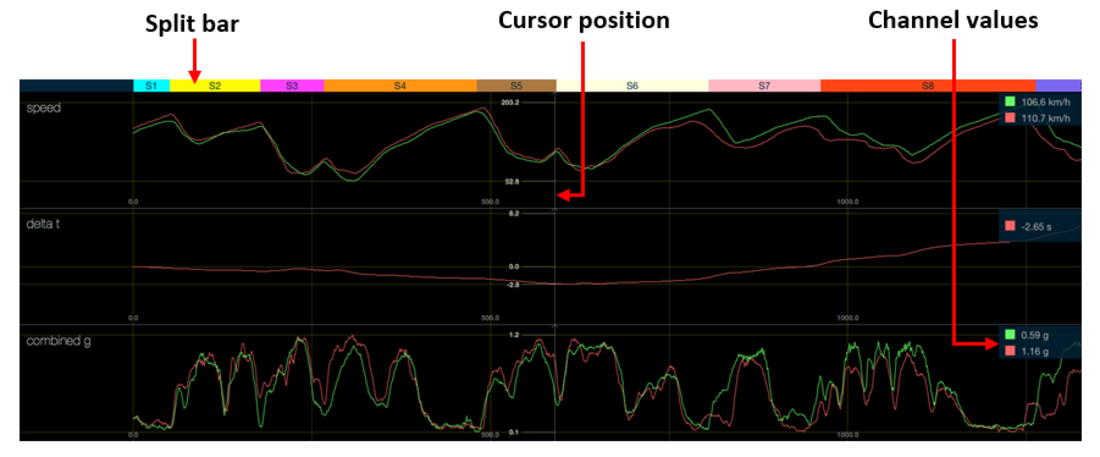
The trace from the fastest lap will automatically be selected and displayed when you load a file. You can chose a second lap to compare against in the Laps area (a maximum of 2 laps can be selected for comparison). If you have loaded multiple files, the fastest lap from each file will be automatically selected and displayed for comparison.
The fastest lap, or if only one lap is selected, will have a green trace, and the second lap will have a red trace.
To move through a file, drag the Graph to the left or right. The legend on the right-hand side of the screen will update the channel values accordingly. Moving the cursor in the Graph area will also move the cursor in the Laps area, and if you are displaying a Video, it will also skip to the selected location. A coloured bar above the graph shows where each split is in relation to the graph data. Clicking on a split will zoom the chart to that split.
You can zoom to a specific part of the graph by left-clicking and dragging over the target area on the split bar. Pressing the Expand  button will toggle the graph view to full screen mode, or reset it to the default view.
Delta-T (Lap-time Difference)
By far the most useful parameter for comparing Laps is the Delta-T channel. Delta-T is the running lap time difference between two laps and gives a very clear indication of where time is lost or gained around the circuit.
When the Delta-T is increasing, you are losing time, when it is decreasing, you are gaining time.
The first step is to look for the largest changes in Delta-T and concentrate on these areas.
Sometimes, in a corner, there may be a large gain followed by a large loss. This often happens when you enter a corner faster, but exit it more slowly.
It is often surprising how much time you lose down the straight by exiting a corner a little bit slower than before.
Lap Alignment - Time vs. Position
There are two ways of aligning comparison data: Time and Position. Position is the default X-axis and this is the method we recommend for comparing two different laps. You can use Time in special circumstances. You can change the alignment by clicking on the Settings button at the top right of the screen.

Available Standard Channels
You can change the selected channels by using the Select Channels  button.
| Speed (km/h) | GPS Speed over ground |
| Delta-T (s) | Lap time difference between two laps |
| Lat acc (g) | Lateral acceleration (cornering g-force) |
| Long acc (g) | Longitudinal acceleration (accel/braking g-force) |
| Combined g | Combined lateral and longitudinal acceleration |
| UTC time (s) | Co-ordinated Universal Time |
| Distance (m) | Rolling distance travelled since start of lap |
| Satellites | Number of satellites being tracked |
| Latitude | Latitude position in degrees and minutes |
| Longitude | Longitude position in degrees and minutes |
| Heading (°) | Vehicle heading in degrees |
| Height (m) | Height |
| Vertical velocity (m/s) | Vertical velocity |
You can view additional channels, such as CAN acquired channels, by scrolling down in the popup menu.
Thumbnails
Thumbnails are shown above the graph and allow interesting parts of a lap to be identified quickly. Each thumbnail image shows a still from the video at the part of the graph that is level with the left side of the thumbnail. There is also a Current Position indicator that let you know how far through the lap you are.
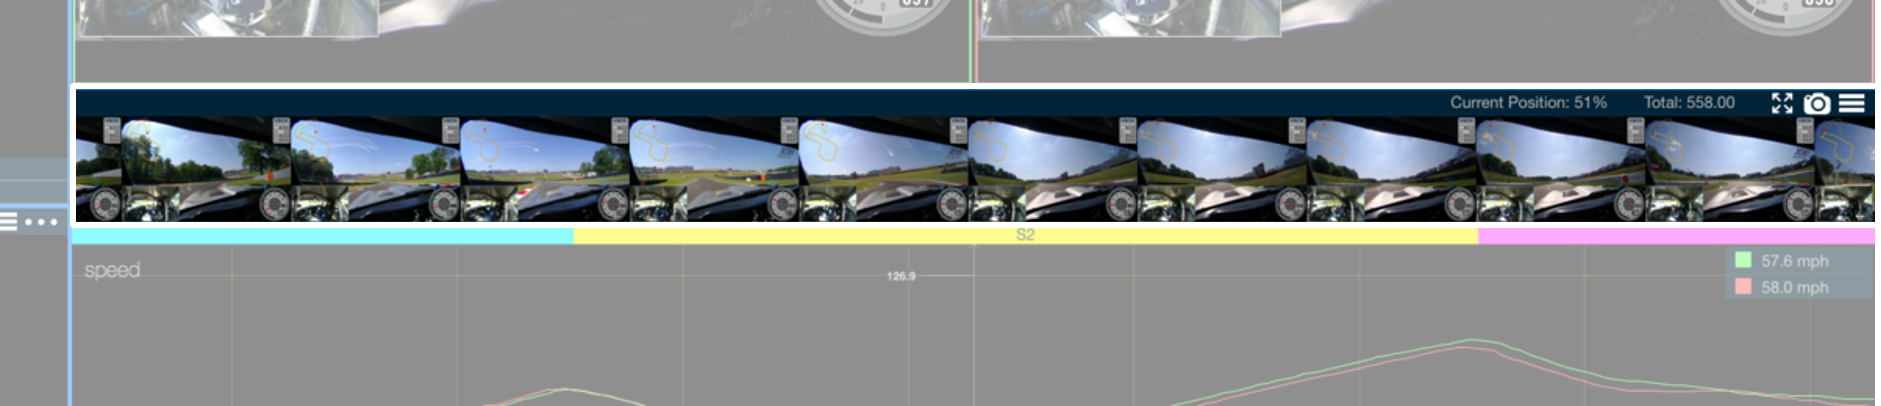
You can hide thumbnails by using the Show/Hide Thumbnails  button, or by using the Command + T shortcut.
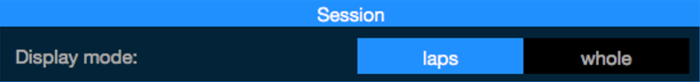
Changing the Display Mode
You can use the Settings button at the top right of the screen to change whether individual laps are displayed or the whole session.
Controls
|
Toggle between expanding the graph view to full screen mode or resetting it to default view. |
|
Toggle the thumbnail view. |
|
Show available channels to compare. |
| Zoom |
Magic Mouse: Single finger swipe up/down Standard mouse: Wheel Keyboard: Up and down arrow keys |
| Pan |
Keyboard: Left and right arrow keys for large increments, Alt + Left and right arrow keys for smaller increments Magic Mouse: Single finger swipe left/ right Trackpad: Swipe with two fingers left/ right. Standard mouse: Left click and drag. |