01 - VBOX Tools Introduction
Introduction
Welcome to VBOX Tools software. This software program enables you to configure the setup of your VBOX or to view and process the VBOX data either in real time or in post-processing.
The VBOX Tools software is based around the ‘Report Generator’ data-processing engine, with links to Graphing tools, Mapping tools, Live Data windows and VBOX Setup tools. Using a combination of these elements, and existing default profiles, allows the user to generate complex testing scenarios with ease.
The examples given in this user manual usually relate to the VBOXIII or VBOX3i. Customers using other products, in particular the VBOX Mini and VBOX Speed Sensors, should be aware that there are some differences between the operation of their units and the instructions given here. Please consult the user guide for your VBOX product for more detailed operating and installation instructions.
Installation
The VBOX Tools software must be installed onto the hard drive of a computer; it cannot be run from the installation CD.
To install the software, either insert the CD provided into the CD drive of your computer, or download the installer from here.
The VBOX Tools installation automatically detects the language settings of the computer and installs the software in the relevant language. Follow the on-screen instructions to complete the installation.
Note: VBOX Tools software is not limited to one user or computer; it can be installed on more than one computer.
Registration
So that Racelogic can continue to provide you with notification of the latest software releases and firmware upgrades and to offer technical support, please register your application. You can fill out the supplied registration form and return it to Racelogic or you can click the ‘Register by email’ button on the opening splash screen of the software and follow the instructions.
The software can be used without registering by clicking the ‘Register Later’ button. However, VBOXs using older versions of firmware will only work with VBOXTools if the software is registered.
Insert the compact flash / SD card into a suitable card reader that has been installed in a computer running the VBOXTools software, or connect the VBOX Mini to the computer using a USB cable to download data from the SD card.
.png?revision=1)
Viewing Logged Data
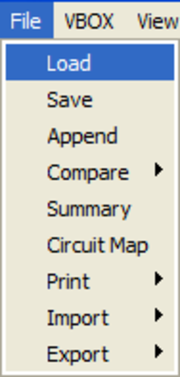
From the main menu bar of the VBOX Tools software click on the ‘File > load’ icon. This will bring up a File Browser dialog box where you can point to the compact flash card location, then click and open the VBOX .VBO data file stored on the card. The VBOX Tools software has now loaded the file into its background memory. To view this file in the Graph screen click the ‘Graph’ icon in the main tool bar. The Graph screen will appear, displaying the data from your logged file in four windows (If the data file has been logged by a VVB then a fifth video player window will also open):
| Window | Display |
|---|---|
| Graph | This main window shows speed against time. |
| Graph : Data | Contains a table of data collected. |
| Graph : Map | Shows the path of the vehicle. |
|
Windows Video Player |
If the logged data file was recorded with a Video VBOX a video player window will open and display the corresponding AVI file. |
.png?revision=1)
Viewing a data point
The cursor in the main window can be moved using the keyboard’s arrow keys, by moving the mouse to a new location and clicking the left mouse button, or by clicking on the cursor and dragging the mouse left or right. When the cursor is moved the Data table displays the value of the data at that cursor position. The crosshairs in the Map window also indicate the position of the vehicle at the time selected by the cursor.
Zooming
Graph: To zoom in on a portion of the Graph window click with the left mouse button and drag the mouse to the right over the area you wish to zoom. To zoom out to the Graph limits, click and drag from right to left.
Map: On the Map window, select an area to zoom in on by clicking the left mouse button and dragging the mouse to the right and down. To zoom out to the Map’s limits again, click and drag the mouse in any other direction.
In both the Graph and the Map, the up and down arrows and the mouse wheel can be used to zoom in and out around the graph’s centre. Pressing shift whilst doing this, zooms in larger steps.
The Data window contains a table of channels logged by the VBOX that are available for viewing in the Graph window. If you wish to view any of these channels check the tickbox to the left of the channel name. Uncheck the tickbox to deselect them.
Graph Measure Tool
To provide a quick summary of sections of the data in the Graph screen use the ‘Graph Measure Tool’.
Move the cursor line to the start of the section you wish to highlight and place the mouse pointer over the cursor. Press and hold the ‘shift’ key then click and hold the left mouse button. Keeping the left mouse button pressed, move the mouse cursor right to drag out a blue highlighted area. At the end of the area you wish to highlight, release the left mouse button, a table of results for all channels in the highlighted area will then be displayed. Refer to the ‘Graph Measure Tool’ section of this manual for more information.
.png?revision=1)
Viewing Live Data
Connect the VBOX to a vehicle as described earlier in the section ‘Setting up the VBOX on a Vehicle’. Then connect the serial communication cable CAB01 to a computer running the latest VBOX Tools software. If the VBOX Tools software does not already have the data source set to ‘Online’ then press the F11 button or click on the connection button in the top right section of the main menu bar. When using a VBOX Mini, connect the unit to the computer via the supplied USB cable and ensure that the USB mode option in the VBOX Mini is set to ‘VBOX TOOLS’
The Connection Detail box in the top right will indicate whether VBOX Tools is connected to a COM port and the top title bar will display the connection information.
.png?revision=1) |
.png?revision=1) |
The VBOX Tools software allows the user to create multiple new windows displaying live VBOX data in any one of six formats:
|
|
|
|
|
|
Create a new window by clicking on the ‘New Data Display’ icon in the main button bar. Each time the ‘New Data Display’ button is clicked a new window displaying speed will appear.
.png?revision=1)
To change the channel displayed in a window right click inside the display pane. Select ‘Main Data’ and choose a channel from the list of those available.
.png?revision=1)
NB: The channels in the ‘Lap Timing Channels’ category will only update if both of the following conditions are true:
- A set of start/finish/split lines have been created or loaded into the software.
- The Report Generator is running a test (live or post-processed) which uses start/finish/split lines as the start, end or line conditions.
|
To change the format of the display window right click inside the display pane. Then from the ‘Display Type’ menu select one of the six alternative options. |
.png?revision=1) |
In a Line Graph window more than one channel can be shown on the same line graph, for example if four wheel speeds were being logged then these channels could all be shown in the same window. Below is an example of some of the live windows and the different formats they can be displayed in.
.png?revision=1)
For further instruction on live windows can be found in the ‘Data Display’ section, for the on-line processing of data please refer to the ‘Report Generator’ section of this manual.
Viewing Data as Numerical Results
|
Numerical results from vehicle tests can be extracted from a logged VBOX file or from live VBOX data using the VBOXTools software.
To extract typical acceleration test results from a logged VBOX file on a compact flash card, first insert the compact flash card into a card reader connected to the computer and run the VBOXTools software. Load the file into the software using the ‘File - load’ option found in the main menu bar. |
.png?revision=1) |
NB: you can also use the ‘Report Generator - load into RepGen’ option, but the data will then not be available in the graph screen.
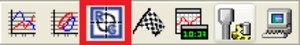
Click on the ‘Report Generator’ icon in the main tool bar to open the Report Generator screen.
.png?revision=1)
Then click the ‘Accel Test’ button in the Report Generator Button Bar to configure the screen to show typical acceleration results. If the Accel Test has been replaced with a custom profile, it can be restored using the ‘Reset to default’ option under the ‘Default Test’ options of the Report Generator menu.
.png?revision=1)
|
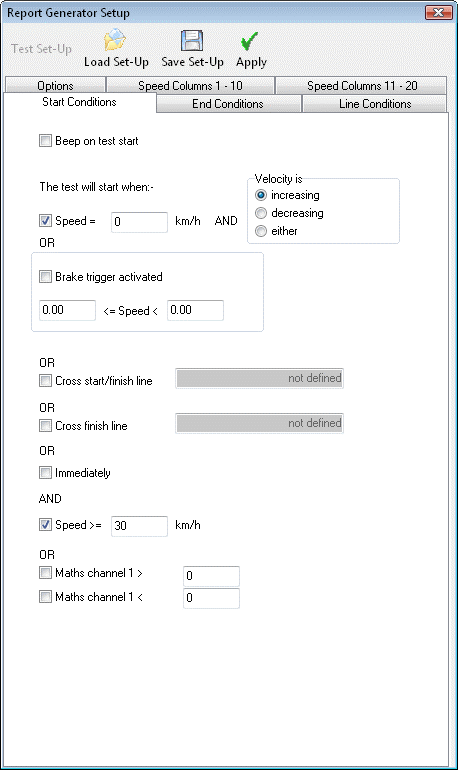
The ‘Accel Test’ icon loads in a set of pre-defined settings, created by Racelogic which can then be modified to suit your personal needs. To do this click the ‘Test Set-up’ icon and and the Report Generator Set Up screen will appear.
Set the start and end speeds to the required values for the test, for example if the test is a 0-100km/h test then set the start speed to 0km/h and the end speed to 100km/h. Click the ‘Apply’ button and then close the Test Setup window. The Report Generator window is now set to scan the file and extract all results of 0-100km/h tests. |
 |
|
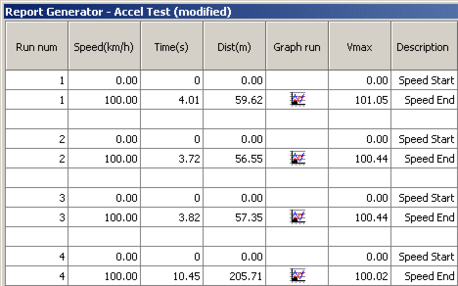
Click the ‘Scan File F2’ button to produce a table of results from all of the 0-100km/h tests in the loaded file.
The Report Generator screen can also be used in a ‘real time’ mode to process live results from VBOX data.
For further information on using the Report Generator screen refer to the chapter ‘VBOXTools - Report Generator’. |
.png?revision=1) |
.png?revision=1)