02 - VBOX Test Suite Getting Started
Launching the software
After installation, VBOX Test Suite can be launched by selecting it from the list of programs on your computer, or by launching a configuration (.vbts) file.
When launching via the main program list, the user will be presented with a pre-loaded ‘Workspace’ and the software will be ‘Offline’ ready to accept a saved data file (.vbo or .dbn files).
If the user launches the software via a .vbts file, it will start up with the same settings that were saved within the .vbts file. This will include any open tests and their test configurations, the window layout and also the units used.
IMPORTANT – Microsoft Windows 7 SP1 or newer is required to use the software (must be compatible with .Net Framework 4.7.1)
Workspace
The workspace is an area that has been designed for non-test specific file analysis and is automatically loaded every time the software is launched. The Workspace can be used in both offline and online modes and contains 3 main areas, as described below.
.png?revision=2)
Extra workspaces can be added via the 'Add Test' button or by adding a new test tab and selecting the ‘Workspace’ icon in the home tab.
The Dashboard
The dashboard is an area where the user can display live or post process data on a series of gauges, as well starting, stopping and resetting tests when in online mode.
There are 5 main types of gauge types:-
- Default – A standard alpha numeric representation of the data.
- Chart – A line graph representation of the data (for use with Online mode only).
- Target – A cursor indicates the data value on a user specified number line.
- Angular Meter – A ‘needle’ type gauge that displays the data value on a circular gauge.
- Level – The data is displayed as a % fill of a bar.
These gauges are demonstrated in the image below.
.png?revision=1)
The Chart Area
The chart area is an area that allows the user to see a graphical representation of the data contained within a file.
.png?revision=1)
Within this chart area it is possible to create a custom graph of one channel vs another (for example speed against time), as well as add multiple channels on one common X-Axis.
Note: The chart area will only be populated from post process data and will not display a live plot of the data. If a live plot is required, the user must use a 'Chart' gauge in the dashboard.
The Map Area
The map area is an area that shows a positional trace from the saved data contained within a file.
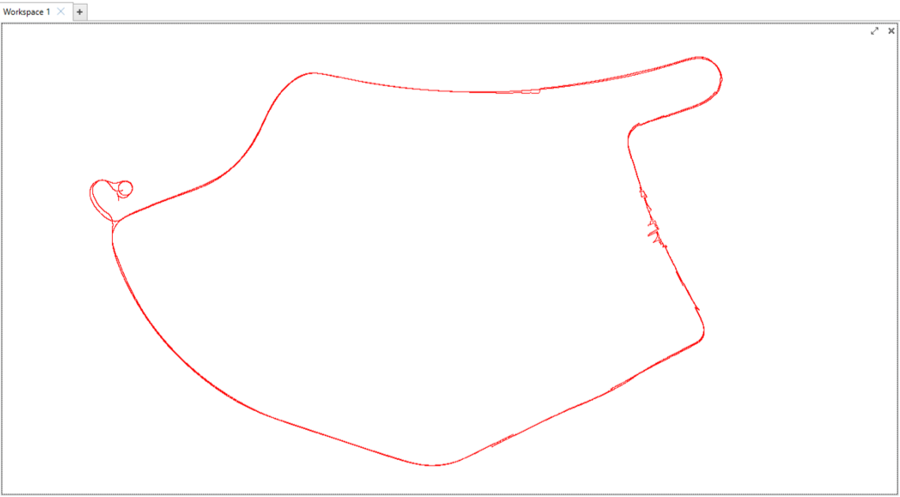
Note: The map area will only be populated from post process data and will not display a live plot of the data. If a live plot is required, the user must add a 'Position' gauge to the dashboard.
Viewing a saved file
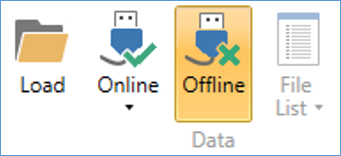
To view a saved file, the user must first ensure that they are in 'Offline' mode. This is done by selecting the 'Offline' button on the home tab of the ribbon bar.
Once offline, the user can load a file by either pressing the 'Load' button on the 'Ribbon' bar, or the 'Load Data' option from the 'File' menu. Once either of these options have been selected, a file browser window will be displayed, allow the user to select a previously saved file (.vbo or .dbn). Opening the desired file will automatically load the data into all open tests, automatically populating the chart and test areas.
Viewing Live VBOX Data
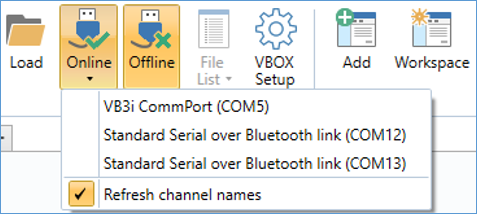
To view live data from a VBOX, the user must first connect to the VBOX and be in 'Online' mode. This is done by selecting the online button on the ribbon bar. Once selected, a drop down menu will appear that allows the user to choose a COM port to connect to.
Once the software is connected to a VBOX, the dashboard gauges will automatically start to display the data being sent live over the VBOX’s serial stream.
In this Online mode, Start, Stop and Reset buttons will appear on the dashboard. These buttons are used to start, stop and reset any open tests.
When in online mode, a newly-created session will be populated with session data from the previous session (if entered).
Live data can also be viewed using the portable VBOX Sport, more information can be found here.
Note: The COM port selection can be cancelled before the software has fully opened online communications. This is done by selecting the X button at the bottom left of the software window, as shown below.
.png?revision=1)
If the connection is lost when using a Bluetooth connection, a 'Disconnected' message is displayed. To reconnect again, select the 'Try Reconnect' option.
Refresh Channel Names
This option is selected by default and means that the CAN channels being transmitted to the software are refreshed when connection is established.
If this is switched off, VBOX Test Suite will store the channel names from the last online session. When connected, any CAN channels from modules that are no longer connected will be included as unnamed channels. If the number of CAN channels in the serial stream for the new VBOX connection matches the number of CAN channels in the last online session, you will be prompted to set the channel names from the last connection.
Turning this feature off is particularly useful when conducting Pass-By Noise testing, where you would like to view the channels from the mini input module (which was previously connected to a VB3i for configuration and connected online within VBOX Test Suite) that is connected to a sound level meter roadside and communicating with the VB3i via radio. Within this application, the mini input module must be set as ‘Sound Level Meter(s) only mode.
This feature was previously referred to in VBOX Tools software as 'Telemetry mode'.
Saving Live VBOX Data
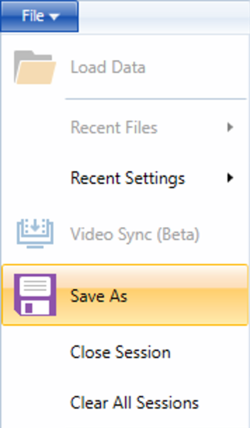
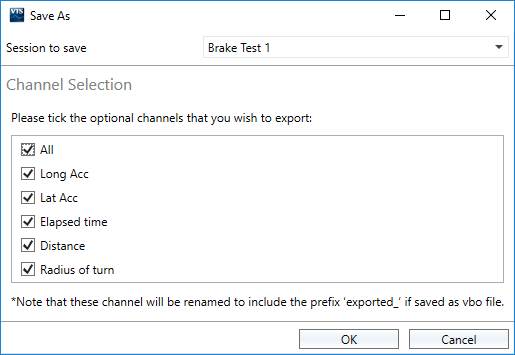
Whilst in 'Online' mode, live VBOX data can be saved as a .vbo or .csv file when a test has been completed. To do this, once a test has finished, navigate to the 'File' menu at the top left of the 'Ribbon' bar and select 'Save As' from the dropdown.
A pop up will then appear enabling you to choose VBOX Test Suite calculated channels, configured maths channels and test plugin specific channels to be included within the file. If there are multiple sessions, you can choose which one to save by using the drop down within the 'Session to save' option.
Pressing 'OK' will then let you name and save the file locally on the PC, enabling you to load this file in to VBOX Test Suite or a spreadsheet program for analysis at a later date.
Note: The saved .vbo will mirror the test data stored on the storage medium within the unit.
 |
 |
Adding/Replacing a Test
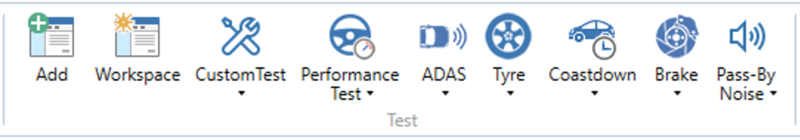
VBOX Test Suite has the ability to add in pre-defined tests. This can be done by either selecting the ‘Add’ button on the home tab or selecting the desired test from the test drop downs on the home tab.
Pressing the 'Add' button will bring up the add test window that will allow the user to browse the available tests.
.png?revision=1)
The add test window is split into various sections, Categories, tests, saved settings, description, version and licence.
The 'Categories' area contains the main category groups of tests, selecting a category will show the tests from that category in the 'Tests' area. The user can then select a test from the list, which will then display a short description of the test in the 'Description' area, the version number in the 'Version' area and the licence information and status in the 'Licence' area. A list of previously saved tests configurations will be displayed in the 'Saved Settings' area which the user can choose to load, or they can just load the default version of that test.
Once a test has been selected, a new tab will be displayed within the main software window.
For a quick way to swap the current test to a different test, VBOX Test Suite displays all the available test categories on the home tab.
By selecting one of these buttons, a drop down list of all default and custom tests will be displayed to the user and selecting one of these tests will load that test configuration into the currently selected test tab.
The user can also add a new tab by clicking the ‘+’ button next to the test tab header.
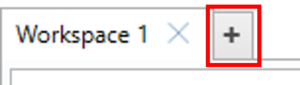
Doing this will open a new, blank test tab that can then be populated using the above method.