Lane Change
The ‘Lane Change’ test is a plugin for VBOX Test Suite software.
The test itself allows the user to complete and analyse various different lane Change tests, such as the ISO 3888-2.
Ribbon Bar
The Lane Change test has a tailored 'Test Setup' ribbon bar, from which the test and test area can be configured.
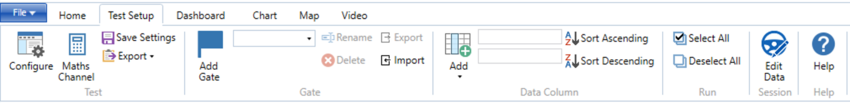
Note: Ribbon bar icons may move/ resize dependent on the Software window size.
Test Setup
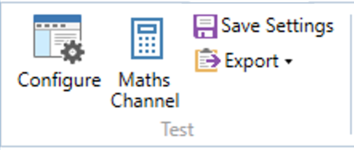
Configure
The 'Configure' button displays a pop up window whereby the parameters of the test can be defined.
Save Settings
The 'Save Settings' button will save this individual test setup and will appear in the ‘Saved Settings’ area of the ‘Add Test’ window.
This test will also be added to the list of Lane Change tests under the 'Performance Test' icon on the 'Home' tab for easy switching of the current test.
Gate
The Gate area will mirror the gate options available in each test. You can find more information on the individual Test Page. If you have not chosen a test, the Gate area will default to the following:
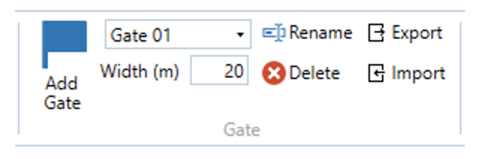
Add Gate (Space)
Clicking the Add Gate button will add a virtual gate to the chart and map at the point of the cursor. You can also add a gate at your current location by pressing the space button on your keyboard. The gate is indicated by green lines. The currently selected gate will be indicated by a blue line.
When you have added a gate, you can specify the gate width. The default gate width is 20 m.
Note: If you change the gate width, the last used gate width will be used as the default width for the next gate.
You can now use the gates as start or end conditions.
Note: Opening a plugin (either as a new tab or overwriting an existing one) will clear all set gates. If you do this you must, therefore, redefine the gates before you amend the test configuration to set start/end conditions.
|
IMPORTANT |
Rename
Click on this button to rename the currently selected gate line.
Delete
Click on this button to delete the currently selected gate line.
Export
Click on this button to export the created gate(s) as a .spl file that can be reused at a later date and can be used with another VBOX product.
Import
Click on this button to import a previously saved or provided .spl file. When this is imported, the gates will be added in the order that they were saved in the .spl file.
Data Column
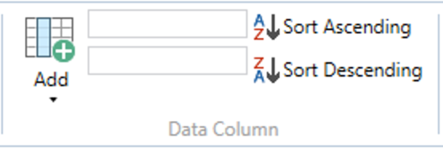
Add
The 'Add' button adds a column to the test results area. Selecting this button will bring up a drop down window where the user can select a channel to display in the test results window.
Sort Ascending/Sort Descending
The Sort Ascending and Sort Descending buttons will sort the values based on the currently selected column in the results area.
Run
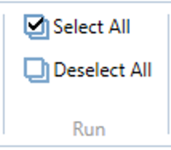
Select All (Ctrl+A)
The 'Select All' button allows the user to tick every run in the results area at once. This can also be accessed by using the keyboard shortcut 'Ctrl+A'.
Deselect All (Ctrl+E)
The 'Deselect All' button allows the user to de select every run in the results area at once. This can also be accessed by using the keyboard shortcut 'Ctrl+E'.
Edit Data
The 'Edit Data' button allows the user to enter session specific data such as driver name, track facility and weather data.
Help (F1)
Pressing this 'Help' button will automatically open an internet browsing window and load the relevant section of the Racelogic Support Centre. This page will only be displayed if there is a valid internet connection. If there is no valid internet connection, a cached version of the relevant section (from the last software update) will be presented in PDF form. This can also be accessed by using the keyboard shortcut 'F1'.
Test Configuration
Selecting the 'Configure' button will display a pop up window where the user can define the parameters of the test. These include the start and end conditions, as well as the pass conditions.
Use the up and down buttons  to the right of the parameters to Expand and Collapse the parameter headings.
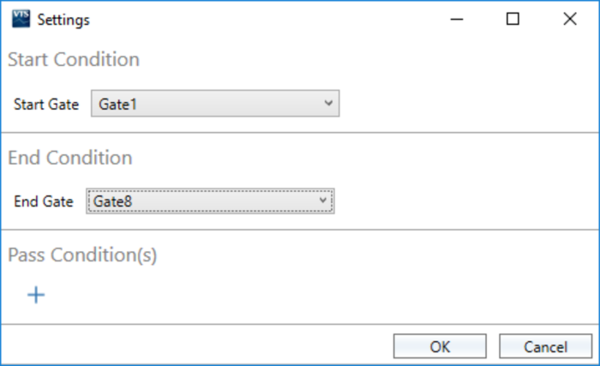
Start/End Condition
These parameters denote when the test will start and finish. From the drop down menu, the user can set the test to begin and finish when the vehicle has passed through a particular set gate.
Pass Conditions(s)
VBOX Test Suite allows the user to specify a channel that can be used to easily identify if certain parameters have exceeded a set threshold, and as such will highlight the run red to mark it as ‘Failed’. The pass conditions can be set so that the run fails whenever the threshold is exceeded, either at the start of the test, at the end of the test, anytime during the test or averaged during the test.
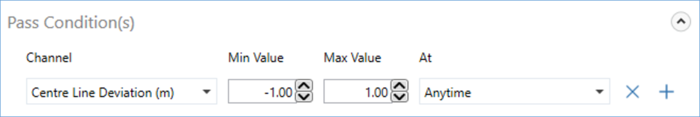
To do this, the user must select a channel from the drop down list and specify a low and high threshold value. More channels can be added by selecting the ‘+’ button.
Completing a Test
To start an online test, the user must first select the correct COM port from the ‘Online’ drop down menu in home tab. Once connected to a VBOX, the dashboard will change to show the 'START', 'STOP' and 'RESET' buttons.
Starting, Stopping and Resetting a Test
By pressing the 'START' button, the software will add a tab to the Test Results area ready to be populated with results once the start and end criteria have been met. The 'START' button will also change to a 'PAUSE' button, allowing the user to pause the test. To resume the test, simply press the 'RESUME' button.
To finish a test, simply press the 'STOP' button. This will stop all open tests. Once the stop button has be pressed, future results cannot be added to that results tab. Pressing the 'START' button will open up a new results tab, however once the stop button has been pressed, the user will be required to calibrate the wheel speeds again (if wheel speed channel(s) are selected) before a new test can be started.
If, for any reason, a mistake has been made during the test, it is possible to restart the test by pressing the 'RESET' button and again this will require a calibration of the wheel speeds.
Test Results Area
The test results area is the area that displays all of the results from the current test. Within this area it is possible to include/exclude results from the chart area, display the average/max/min values and also easily identify any runs which have not met the pass criteria.
Every time a new test is started (via the 'START' button on the dashboard), or a new file is loaded, a new tab will be added to the test results area, allowing the user to switch between separate tests or files and compare runs from each. A session can be removed from the results area by pressing the ‘x’ icon on the tab.
Session Data
By pressing the 'Edit Data' button .jpg?revision=1&size=bestfit&width=60&height=57) next to the name of the file/run or in the ‘Test Setup' ribbon bar, a new window will be displayed whereby the user can add various different pieces of vehicle and test information, such as:-
next to the name of the file/run or in the ‘Test Setup' ribbon bar, a new window will be displayed whereby the user can add various different pieces of vehicle and test information, such as:-
-
Vehicle
- Vehicle Model
- Driver Name
- Effective Weight
-
Test
- Test Date
- Time Zone
- Test Track
- Test Facility
- Comments
- Conditions
- Weather
- Temperature
- Track Temperature
When in 'Offline' mode, this information will be saved into the .vbo file meaning that this information will be recalled every time the file is loaded into VBOX Test Suite.
When in 'Online' mode, a newly-created session will be populated with session data from the previous session.
This information will be included in the test report to allow the user to understand under what conditions the test was conducted.
Note: This data is purely optional and has no effect on the test or test result.
To save time, it is possible for the user to import and export the session information for use in other sessions (the entire range of data is exported not just the visible screen).
Once the session information has been completed, it is possible to export the data to a .vbses file. This file will contain all the session information that can then be imported into the open session information field.
Result Columns
.png?revision=1)
Along the top of the Test results area are some default columns. These columns are:-
- Run – Indicates which run number the results relate to, with run one being the first run completed. There is also a selection box that, when ticked, includes that run in the graph and into the Average/Max/Min/Standard Deviation calculations. Once selected, a coloured square will appear to indicate which colour this run is displayed as on the graph.
Note: If you are loading a file offline, all valid runs are ticked automatically. - Time – The total time the run has taken.
- Distance – The total distance travelled in that run.
- Speed (At Start) – The speed the vehicle was travelling at the start of the run.
- Speed (At End) – The speed the vehicle was travelling at the end of the run.
- Speed (Max) – The maximum speed the vehicle was travelling during the run.
- Speed (Min) – The minimum speed the vehicle was travelling during the run.
Editing a Column
As default, a column is added as an ‘At End’ condition. It is possible to change this by selecting the column title you wish to edit (once selected, the column will be highlighted in yellow) and changing the condition in the ‘data column’ area in the ‘Test Setup’ tab of the ribbon bar.
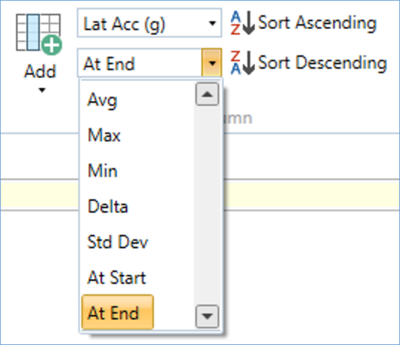
It is possible to choose the following conditions for the main results:-
- Avg – The mean average of the parameter during the run.
- Max – The maximum value of the parameter during the run.
- Min – The minimum value of the parameter during the run.
- Delta – The difference between the start and end value of the parameter.
- Std Dev – The standard deviation of the parameter during the run.
- At Start – The value of the parameter at the start of the run.
- At End – The value of the parameter at the end of the run.
- Gate (if a gate has been added) – The value of the parameter at the crossing of the specified gate line (e.g. Start/Finish).
It is also possible to change the displayed parameter, by using the other drop down menu on the ribbon tab and selecting the desired parameter.
Dashboard
Along with the usual dashboard functionality, the ‘Lane Change’ test has some extra options that can be displayed to the user.
By selecting the 'Add Gauge' button from the dashboard tab, a drop down menu will appear whereby the user can select 'Test' and then the desired parameter to be displayed. On selection, a gauge will be automatically added to the dashboard. Any gauges displaying a result of a test, such as an average or maximum value, will have a 'Result' icon  to the left of the gauge name to indicate that it is either a result of the previous run if viewing live data, or the currently selected run if viewing a saved file.
All Result Column parameters are also available as a gauge.
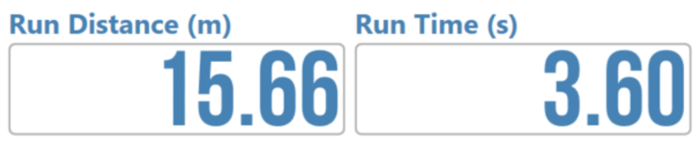
Showing Test Results on the Dashboard
It is possible to display the time and distance test results from the last run completed as a gauge on the dashboard.
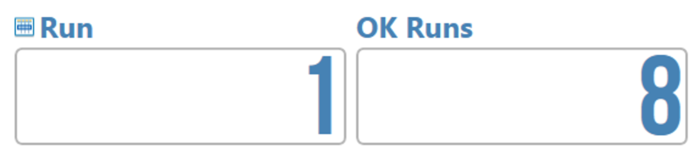
It is also possible to show the current run number on the dashboard to give an easy, clear indication of the amount of runs completed. An 'OK Runs' gauge can be added to indicate how many runs have met any specified pass conditions.
Distance/Time Since Run
The user can also add gauges to the dashboard that show a live value of either time or distance since the completion of the last run.
.png?revision=3)