Park Assist
Introduction
The ‘Park Assist’ test is a plugin for the VBOX Test Suite software and is designed to meet ISO regulation 204/WG14 ISO 16787 ‘Assisted Parking Systems (APS) – parking with reference to other parked vehicles’.
The test itself allows the user to validate Park Assist systems by measuring the distances between the vehicle and the measured parking bay.
Ribbon Bar
The Park Assist test has a unique 'Test Setup' ribbon bar, from which the test and test area can be configured.
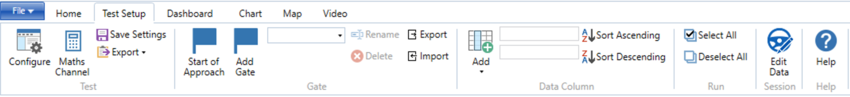
Note: Ribbon bar icons may move/ resize dependent on the Software window size.
Test
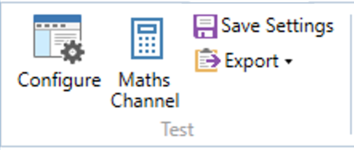
Configure
The 'Configure' button displays a pop up window whereby the parameters of the test can be defined.
Maths Channel
Save Settings
The 'Save Settings' button will save this individual test setup and will appear in the ‘Saved Settings’ area of the ‘Add Test’ window.
This test will also be added to the list of Park Assist tests under the 'ADAS' icon on the 'Home' tab for easy switching of the current test.
Export (Ctrl+E)
Gate
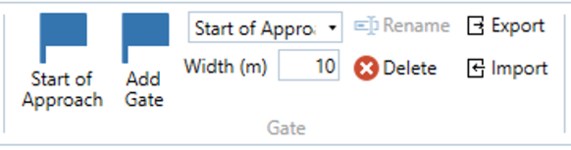
Start of Approach
Pressing the ‘Start of Approach’ button will add a virtual gate to the chart and map area at the point of the cursor, indicated by a purple coloured line which turns to a dark blue coloured line when selected. Once the start of approach has been defined, the width can be specified. This can then be used as a start or end condition and also included within Pass Conditions.
IMPORTANT - When adding a gate, the vehicle must be travelling greater than 0.8 km/h in order to ascertain the heading of the gate.
Add Gate
Pressing the ‘Add Gate’ button will add a virtual gate to the chart and map area at the point of the cursor, indicated by green coloured lines. The currently selected gate is indicated by a dark blue coloured line. Once a gate has been added, the gate width can be specified. These gates can then be used as a start or end condition.
IMPORTANT - When adding a gate, the vehicle must be travelling greater than 0.8 km/h in order to ascertain the heading of the gate.
Rename
Delete
Export/Import
Data Column
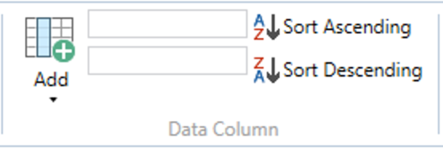
Add
Sort Ascending
Run
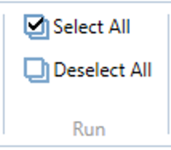
Select All (Ctrl+A)
Deselect All (Ctrl+E)
Edit Data
The 'Edit Data' button allows the user to enter session specific data such as tyre specification.
Help (F1)
Pressing this 'Help' button will automatically open an internet browsing window and load the relevant section of the Racelogic Support Centre. This page will only be displayed if there is a valid internet connection. If there is no valid internet connection, a cached version of the relevant section (from the last software update) will be presented in PDF form. This can also be accessed by using the keyboard shortcut 'F1'.
Test Configuration
Selecting the 'Configure' button will display a pop up window where the user can define the parameters of the test. These include the start and end conditions, the bay sides, measurement options, as well as the pass conditions.
Use the up and down buttons  to the right of the parameters to Expand and Collapse the parameter headings.
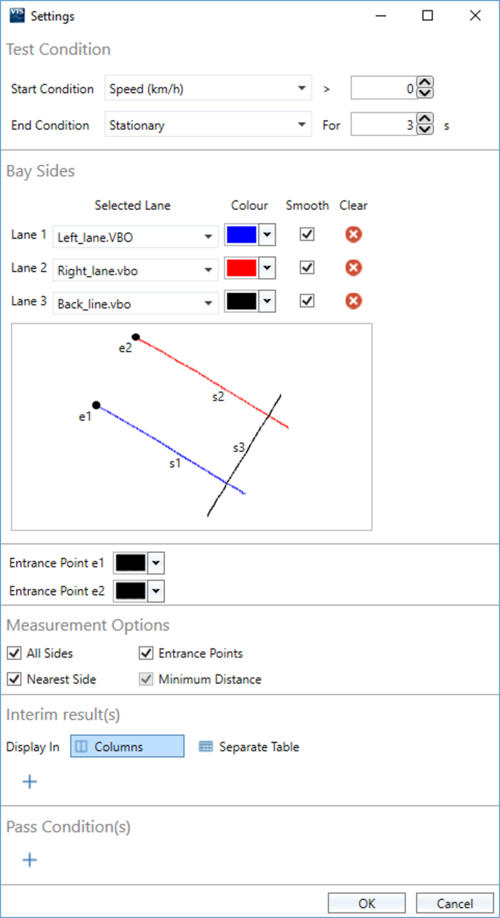
Start Condition
This parameter denotes when the test will start. From the drop down menu, the user can set the test to begin at a speed, on a trigger, when a gate is crossed or when a CAN channel is greater than a user defined positive or negative value.
Notes:
- Set to Speed and 0 km/h by default.
- If a trigger is used as the start condition, the test will not restart if the trigger is activated within 1 second of the previous trigger activation.
End Condition
The end condition denote the criteria at which the test will end. It is possible to end the test after a stationary period, on a trigger, when a gate is crossed or when a CAN channel reaches a user defined positive or negative value.
Note: Set to Stationary for 3 seconds by default.
Bay Sides
The Park Assist test can be used to create any virtual three-sided parking bay with straight lines or a parking bay with complex shape sides (i.e. vehicles either side), for use with reverse or parallel parking tests.
A bay must be configured from 2 or 3 separate files which have been plotted by the user. A bay cannot be created from a single logged file.
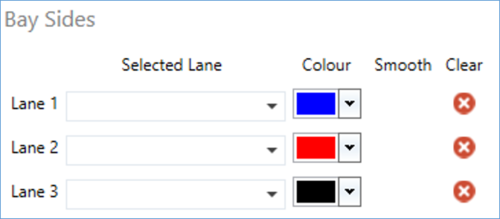
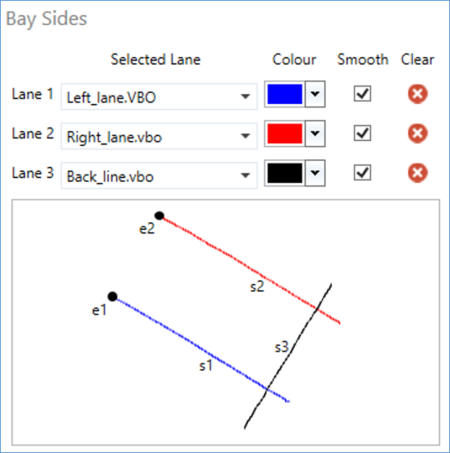
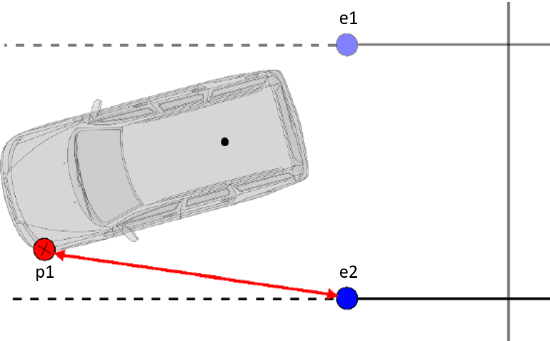
The bay sides can be either loaded from a saved file, or surveyed live within the software when in 'Online' mode. Once the bay sides have been configured, you can use the window at the bottom to visualise (check) the bay, designated as s1, s2 and s3 with entrance points e1 and e2. You are also able to change the associated colours and apply smoothing.
Straight Lines
|
When plotting (recording) a bay side, you are required to extend the plot of the bay side past the corner point, so that there is a clear overlap. When configuring the sides of a bay, ensure the plotting of the bay starts from the entry point, and finishes past the intersection of the ‘base’ bay line.
Once 3 overlapping lines have been defined, the software will automatically determine 2 entry points for the bay, taking the furthest point from intersection. For this reason, the user should ensure they do not plot too far past the corner point of the bay. |
|
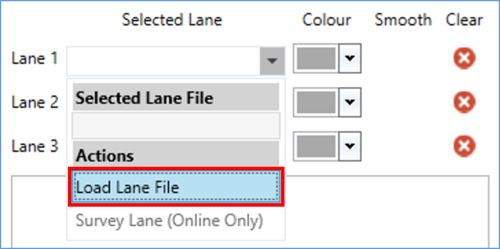
Load Bay Sides
To load the bay sides from saved .vbo (VBOX), .vbc (lane departure), .dbn (PB/DB/VBM) or previously surveyed files, select the dropdown menu next to a lane and click on 'Load Lane File'. Navigate to the saved file and select 'Open' to load in to the software. Repeat for the other lane.
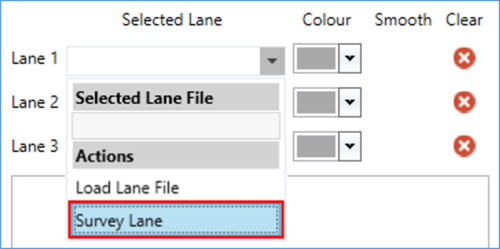
Survey Lanes (Online only)
When VBOX Test Suite is connected to a VBOX in 'Online' mode, the lanes can be surveyed live from within the software using a series of 'static' points to create straight lines. Select the dropdown menu next to a lane and click on 'Survey Lane'.
 |
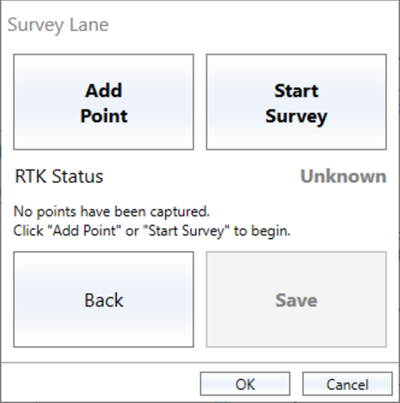 |
Within the Survey Lane window, the current RTK status of the VBOX is shown to give you a clear indication of the DGPS correction status before you begin the survey. For the status to work correctly, the 'Solution Type' channel needs to be chosen to 'Send over serial' within the VBOX Setup Software.
RTK Status messages:
- Fixed
- Float
- Not Fixed
- No Solution
- Unknown
Add Points
Ensure the VBOX equipment is set up for Straight Line Surveying and use the 'Add Point' button function. Once all required points have been set (minimum of 2 points required), select 'Save' and choose a suitable location and filename.
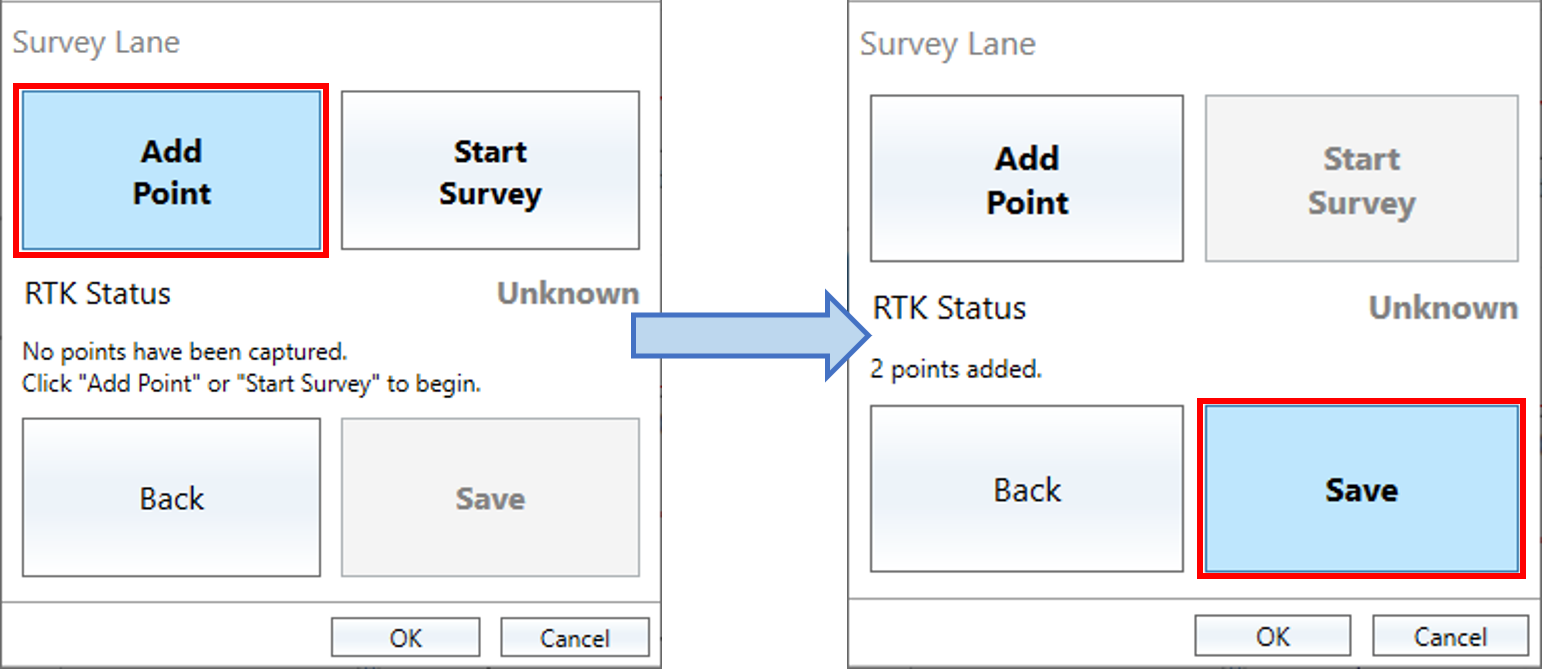
Note: The number of points added is shown within Survey Lane window.
Once saved, the lane will be added to the settings window. The saved lane can also be reused again later by Loading in to the software. Repeat the process for the other lane.
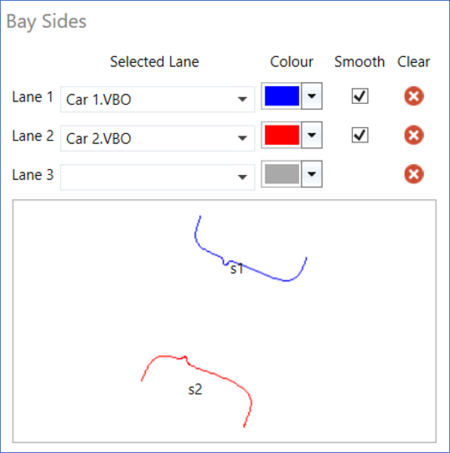
Complex Shapes
|
It is possible to add 2 complex shapes instead of straight lines for bay sides. This allows for testing when there are no parking bay lines and perhaps only vehicles. In the picture example, 2 vehicles sides were surveyed and are located either side of the parking space of interest. It is important to turn 'Smooth' off so that details such as the wing mirrors can be included in the measurement distance calculations. Please note that as there are no longer Entrance points, these channels will not be outputted in the processed files. |
|
Load Bay Sides
To load the bay sides from saved .vbo (VBOX), .vbc (lane departure), .dbn (PB/DB/VBM) or previously surveyed files, select the dropdown menu next to a lane and click on 'Load Lane File'. Navigate to the saved file and select 'Open' to load in to the software. Repeat for the other lanes.
Survey Lanes (Online only)
When VBOX Test Suite is connected to a VBOX in 'Online' mode, the complex shape lanes can be surveyed live from within the software. Select the dropdown menu next to a lane and click on 'Survey Lane'.
|
|
Within the Survey Lane window, the current RTK status of the VBOX is shown to give you a clear indication of the DGPS correction status before you begin the survey. For the status to work correctly, the 'Solution Type' channel needs to be chosen to 'Send over serial' within the VBOX Setup Software.
RTK Status messages:
- Fixed
- Float
- Not Fixed
- No Solution
- Unknown
Survey
Ensure the VBOX equipment is set up for Complex Shape Surveying and select the 'Start Survey' button. Once surveyed, click 'Stop Survey'. Select 'Save' and choose a suitable location and filename.
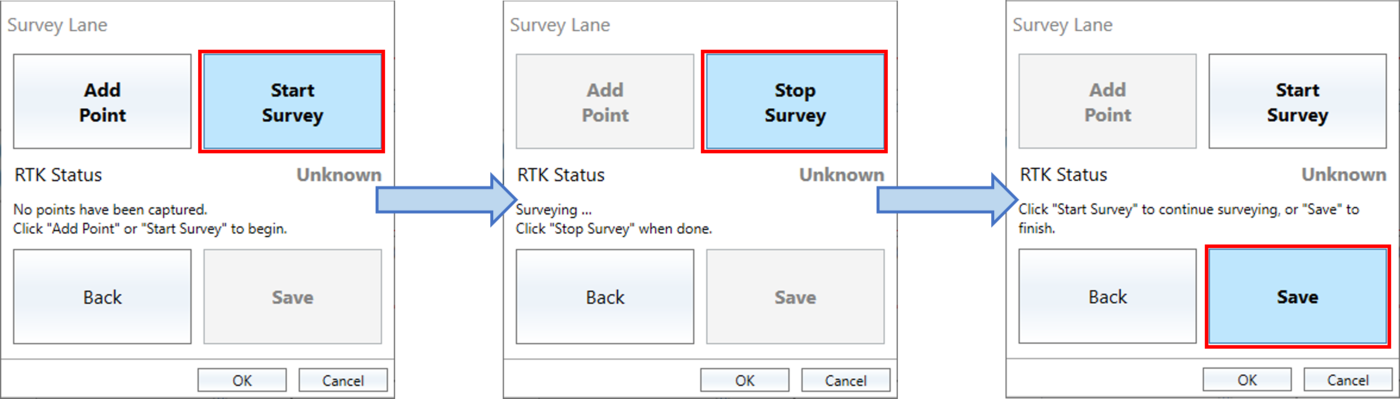
Note: During the survey, the Survey Lane window will display 'Surveying ...'.
Once saved, the bay side will be added to the settings window. The saved bay side can also be reused again later by Loading in to the software. Repeat the process for the other lane.
Measurement Options
This section selects which channels are included in the resulting output file.
- All Sides – Denotes that a measurement to each bay side should be added for each point on the vehicle.
- Nearest Side – Denotes that a measurement to the nearest side should be added for each point on the vehicle.
Note: If all sides is also ticked, one of the sides will contain the same data as the nearest side channel for a given vehicle point. - Entrance Points – Includes a measurement to both entrance points from each vehicle point.
- Minimum Distance – Denotes that a single channel should be added containing the minimum vehicle point to bay side measurement (effectively the minimum distance from the vehicle to any side).
Note: Option permanently selected.
Interim result(s)
|
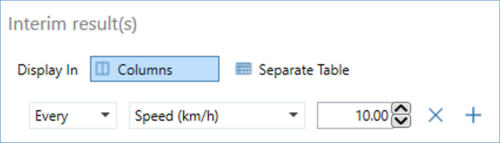
The software allows the user to display intermediary results called ‘Interim results’. The Interim results are determined by adding in ‘Interim Conditions’. Pressing the '+' button will add a new interim result. It is possible to have this line appear at ‘Every’ instance of the value (e.g. Every 10 km/h), ‘At’ an instance of a value (e.g. Only at 10 km/h) or 'Between' values (e.g. Between 30 km/h and 50 km/h). When 'Columns' is selected, each interim result is shown as a column within the right hand side of the results table, if 'Separate Table' is selected, each interim result is shown as a row in a separate table next to the results table. |
 |
Pass Condition(s)
VBOX Test Suite allows the user to specify a channel that can be used to easily identify if certain parameters have exceeded a set threshold, and as such will highlight the run red to mark it as ‘Failed’. The pass conditions can be set so that the run fails whenever the threshold is exceeded, either at the start of the test, at the end of the test, anytime during the test or averaged during the test.
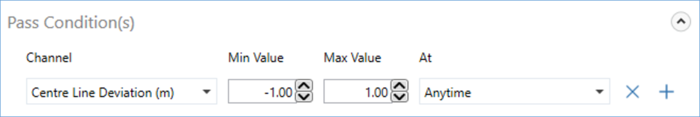
To do this, the user must select a channel from the drop down list and specify a low and high threshold value. More channels can be added by selecting the ‘+’ button.
Along with standard pass condition validation options, if a Start of Approach and/or Gate has been set, it is possible to make a run fail whenever the threshold is exceeded at the start of the approach, at the end of the approach, anytime during the approach, averaged during the approach or at a gate.
Completing a test
To start an online test, the user must first select the correct COM port from the ‘Online’ drop down menu in home tab. Once connected to a VBOX, the dashboard will change to show the 'START', 'STOP' and 'RESET' buttons.
If a dual antenna channel is not detected, the software will warn that a 'Dual antenna Heading channel is not available'.
Starting, Stopping and Resetting a test
Test Results Area
The test results area is the area that displays all of the results from the current test. Within this area it is possible to include/exclude results from the chart area, display the average/max/min values and also easily identify any runs which have not met the pass criteria.
Every time a new test is started (via the 'START' button on the dashboard), or a new file is loaded, a new tab will be added to the test results area, allowing the user to switch between separate tests or files and compare runs from each. A session can be removed from the results area by pressing the ‘x’ icon on the tab.
Note: If a file is loaded that does not have a dual antenna channel, the software will warn that a 'Dual antenna Heading channel is not available'.
Rename File
Session Data
By pressing the 'Edit Data' button .jpg?revision=1&size=bestfit&width=60&height=57) next to the name of the file/run or in the ‘Test Setup' ribbon bar, a new window will be displayed whereby the user can add various different pieces of vehicle and test information, such as:-
next to the name of the file/run or in the ‘Test Setup' ribbon bar, a new window will be displayed whereby the user can add various different pieces of vehicle and test information, such as:-
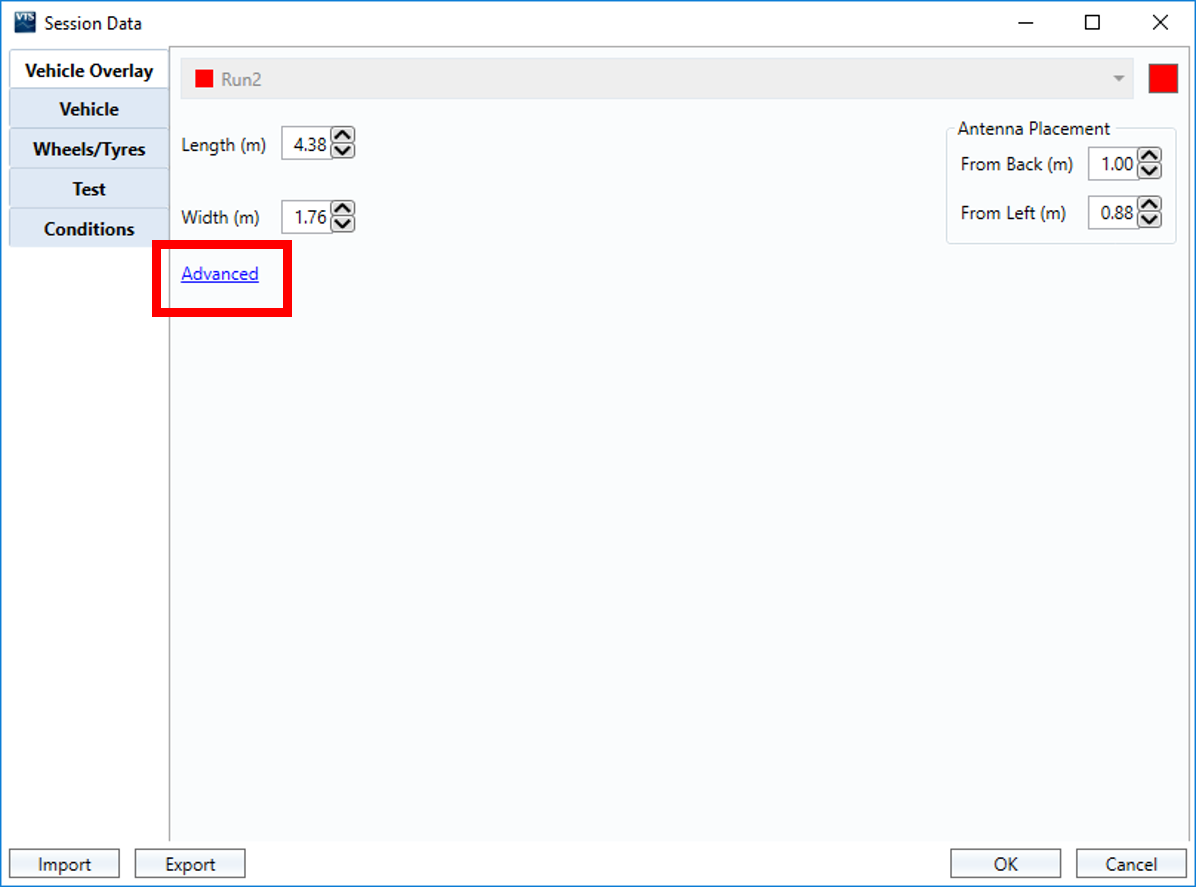
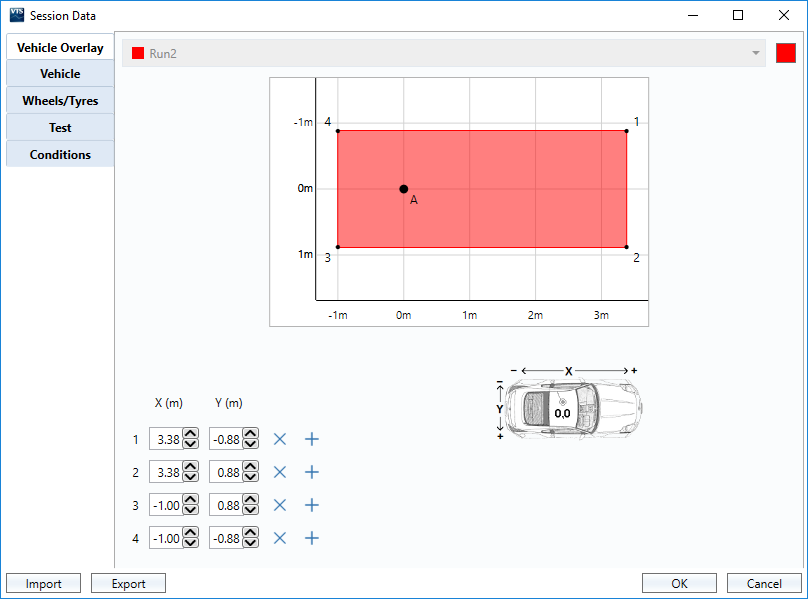
Vehicle Overlay
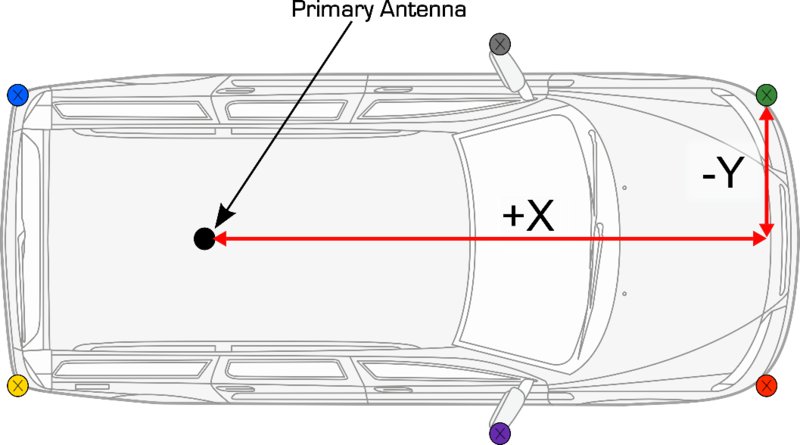
The vehicle overlay section allows the user to configure the required vehicle measurement points and enter antenna placement offsets.
There is no limit to the number of vehicle measurement points that can be set.
Points should be measured from the primary antenna as shown below.
Selecting ‘Advanced’ will expand the window and enable a vehicle point editing functionality, allowing the creation of custom shapes for the vehicle.
Pressing the ‘+’ button will add more points which can be configured by entering antenna offset values. Points can also be manually dragged in to place by selecting and holding the desired point.
|
|
|
Once 'OK' is pressed, the software will create an object representing the vehicle and will overlay this on the cursor within the map area.
If testing with parking bays, each configured vehicle point will produce 5 range channels; 2 relative to entry points and 3 relative to the bay sides. If testing with complex shapes, each point will produce 2 range channels relative to the shape sides.
IMPORTANT - If no vehicle measurement points are entered, the antenna position is used for range calculations.
Other Information
-
Vehicle
- Vehicle Model
- Vehicle Number
- Driver Name
- Unladen Kerb Mass
-
Wheels/Tyres
- Tyre Model
- Tyre Size
- Tyre Pressures
-
Test
- Test Date/Time
- Test Track
- Test Facility
- Comments
- Conditions
- Weather
- Temperature
- Humidity
- Wind Speed
- Wind Direction
- Ambient Illumination
When in 'Offline' mode, the Session Data information will be saved into the .vbo file meaning that this information will be recalled every time the file is loaded into VBOX Test Suite.
When in 'Online' mode, a newly-created session will be populated with session data from the previous session.
Note: The 'Other Information' parameters are purely optional and has no effect on the test or test result.
To save time, it is possible for the user to import and export the session information for use in other sessions (the entire range of data is exported not just the visible screen).
Once the session information has been completed, it is possible to export the data to a .vbses file. This file will contain all the session information that can then be imported into the open session information field.
Result Columns
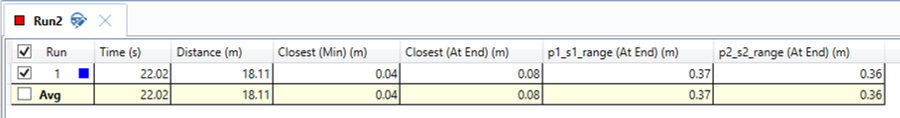
Along the top of the Test results area are some default columns. These columns are:-
- Run – Indicates which run number the results relate to, with run one being the first run completed. There is also a selection box that, when ticked, includes that run in the graph and into the Average/Max/Min/Standard Deviation calculations. Once selected, a coloured square will appear to indicate which colour this run is displayed as on the graph.
Note: If you are loading a file offline, all valid runs are ticked automatically. - Distance – The total distance travelled in that run.
- Closest (Min) – The closest distance to any bay side throughout the whole test.
- Closest (At End) – The closest distance to any bay side at the end of the test.
Adding a Column
Park Assist Specific Measurements
Within the Add column drop down menu, a list of Park Assist specific measurements are available to choose from, e.g. p1_s1_range.
e1 and e2 MeasurementsThe 2 range measurements to bay side entrance points are direct straight line ranges between vehicle and entry point. The created channels will be labelled e1 and e2 relative to what is shown in the ‘bay sides and entrance points’ map. Two measurements in relation to the bay side entrance points will exist for every vehicle measurement point. For example, the p1_e2 measurement is the distance between the second entry point and the first defined vehicle measurement point. Note: e1 and e2 measurements are only available when testing with parking bays. If testing with complex shapes, no entrance points are measured. |
|
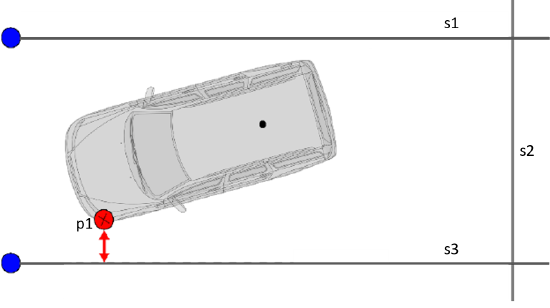
s1, s2 and s3 MeasurementsThe side range measurements are calculated perpendicular to the bay/ complex shape side headings. The created channels will be labelled s1, s2 and s3 relative to what is shown in the ‘bay side and entrance points’ settings. Two or three points in relation to the bay sides will exist for every vehicle measurement point. For example, the p1_s3 measurement is the range of the first defined vehicle measurement point to bay side 3. Note: If testing with complex shapes, only s1 and s2 range measurements are calculated. |
 |
|
If the vehicle is outside of the configured bay/complex shape, the side range measurements are calculated to the closest side point (i.e. the entrance point for a bay).
Note: As all range values are absolute values, they have no signing. |
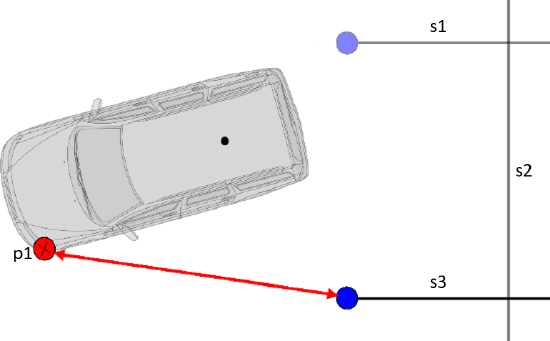 |
Editing a Column
As default, a column is added as an ‘At End’ condition. It is possible to change this by selecting the column title you wish to edit (once selected, the column will be highlighted in yellow) and changing the condition in the ‘data column’ area in the ‘Test Setup’ tab of the ribbon bar.
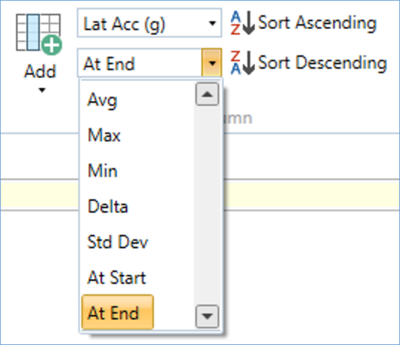
It is possible to choose the following conditions for the main results:-
- Avg – The mean average of the parameter during the run.
- Max – The maximum value of the parameter during the run.
- Min – The minimum value of the parameter during the run.
- Delta – The difference between the start and end value of the parameter.
- Std Dev – The standard deviation of the parameter during the run.
- At Start – The value of the parameter at the start of the run.
- At End – The value of the parameter at the end of the run.
- Start of Approach – The value of the parameter at the crossing of the Start of the Approach line.
- Gate – The value of the parameter at the crossing of the specified gate line (i.e Start of Test).
It is also possible to change the displayed parameter, by using the other drop down menu on the ribbon tab and selecting the desired parameter.
Sorting the Results
Filters
Copying Cells (Ctrl+C), Rows or Columns
Renaming a Column (F2)
Export
Average/Max/Min/Standard Deviation Values
Interim Results
Columns
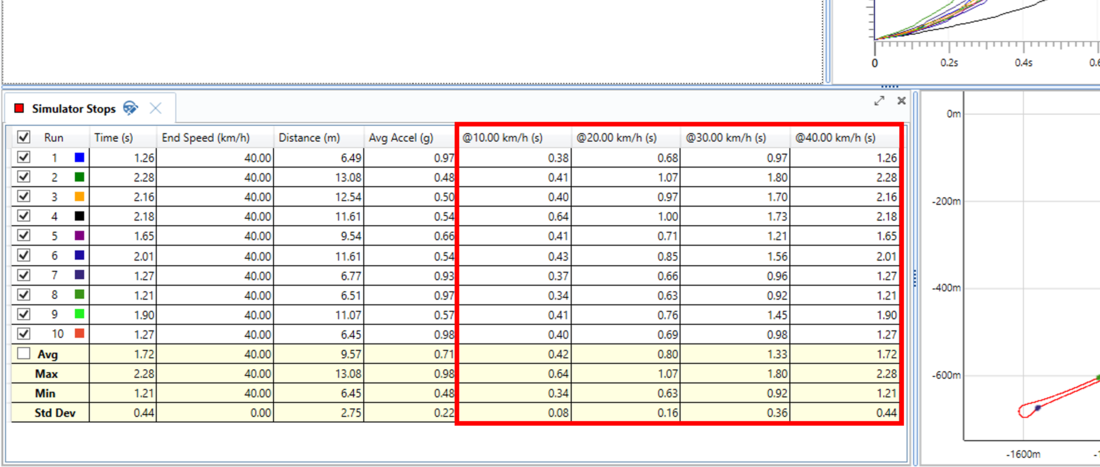
When Interim result(s) have been specified in the Test Configuration as 'Columns', each interim result is shown as a column within the right hand side of the results table in the order it has been specified. If multiple 'At' or 'Between' conditions are met within a run, only the first result will be displayed.
To change the channel used for an interim result(s), select the result and click on the existing channel used within the ‘Test Setup' tab in the ribbon bar or right click on the result and and selecting the existing channel from the dropdown menu. Selecting this will display a list of all available channels.
It is also possible to add columns to the interim result(s) by selecting the result and clicking on the ‘Add’ button on the ‘Test Setup' tab in the ribbon bar or by right clicking on the result and and selecting the ‘Add’ option from the dropdown menu. Selecting this will display a list of all available channels which the user can select to display as a results column associated to that particular interim result.
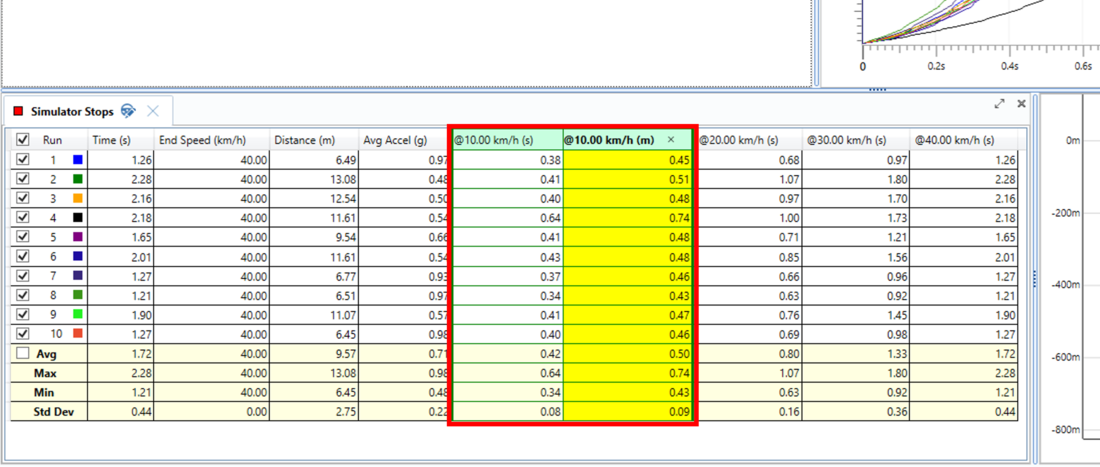
To remove a column, simply select the ‘x’ icon that appears when you hover over the column title.
Note: If a channel has been changed or extra columns have been added to the interim result(s) and the Test Configuration is then Saved, the changed or extra columns will be applied to all interim results when that file is then reloaded back in to the software, not just the results specified.
Separate Table
When Interim result(s) have been specified in the Test Configuration as a 'Separate Table', a new window will appear in the results area that will display the interim results from a selected run. If multiple runs are selected, this window will display the interim results from the last selected run. As well as displaying interim results, the start conditions are also shown.
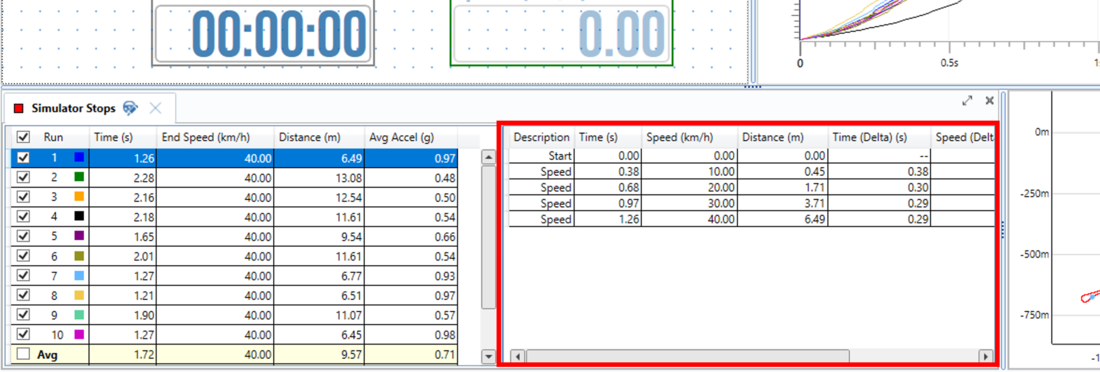
The standard columns in the Interim Results window are:-
- Description – This will explain why this line result was reported.
- Speed – The speed at the time the line condition was met.
- Distance – The distance travelled from the start until the line condition was met.
- Time – The total time from the start of the test run until the line condition was met.
- Distance (Delta) – The distance difference between the line result and the previous line result.
- Time (Delta) – The time difference between the line result and the previous line result.
- Speed (Delta) – The speed difference between the line result and the previous line result.
Columns can be added, edited and sorted in the same way as the results window can be, however the Line results have slightly different reporting conditions. These are:-
- Avg – The mean average of the parameter during the run.
- Max – The maximum value of the parameter during the run.
- Min – The minimum value of the parameter during the run.
- Delta – The difference between the start and end value of the parameter.
- At Line – The value of the parameter when the line condition was met.
Dashboard
Along with the usual dashboard functionality, the ‘Park Assist’ test has some extra options that can be displayed to the user.
By selecting the 'Add Gauge' button from the dashboard tab, a drop down menu will appear whereby the user can select 'Test' and then the desired parameter to be displayed. On selection, a gauge will be automatically added to the dashboard. Any gauges displaying a result of a test, such as an average or maximum value, will have a 'Result' icon  to the left of the gauge name to indicate that it is either a result of the previous run if viewing live data, or the currently selected run if viewing a saved file.
All Result Column parameters are also available as a gauge.
Showing Test Results on the Dashboard
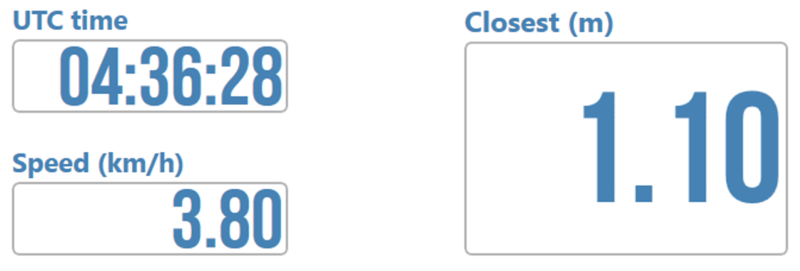
By default, the ‘Park Assist’ test has UTC time, Speed and Closest distance gauges included within the dashboard area.
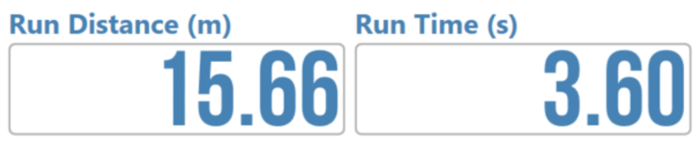
It is possible to display the time and distance test results from the last run completed as a gauge on the dashboard.
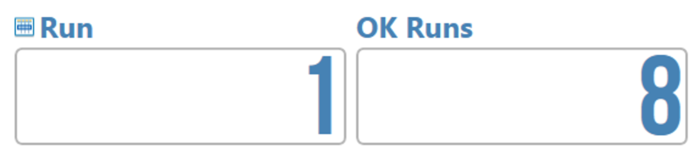
It is also possible to show the current run number on the dashboard to give an easy, clear indication of the amount of runs completed. An 'OK Runs' gauge can also be added to indicate how many runs have met any specified pass conditions.
Other test specific measurements such as individual range measurements can be found within the 'Channels' area of the 'Add Gauge' menu.
Run Status
Distance/Time Since Run
The user can also add gauges to the dashboard that show a live value of either time or distance since the completion of the last run.
.png?revision=3)